Immigrants from Uruguay vs Immigrants from Grenada College, 1 year or more
COMPARE
Immigrants from Uruguay
Immigrants from Grenada
College, 1 year or more
College, 1 year or more Comparison
Immigrants from Uruguay
Immigrants from Grenada
58.1%
COLLEGE, 1 YEAR OR MORE
15.2/ 100
METRIC RATING
208th/ 347
METRIC RANK
54.4%
COLLEGE, 1 YEAR OR MORE
0.2/ 100
METRIC RATING
273rd/ 347
METRIC RANK
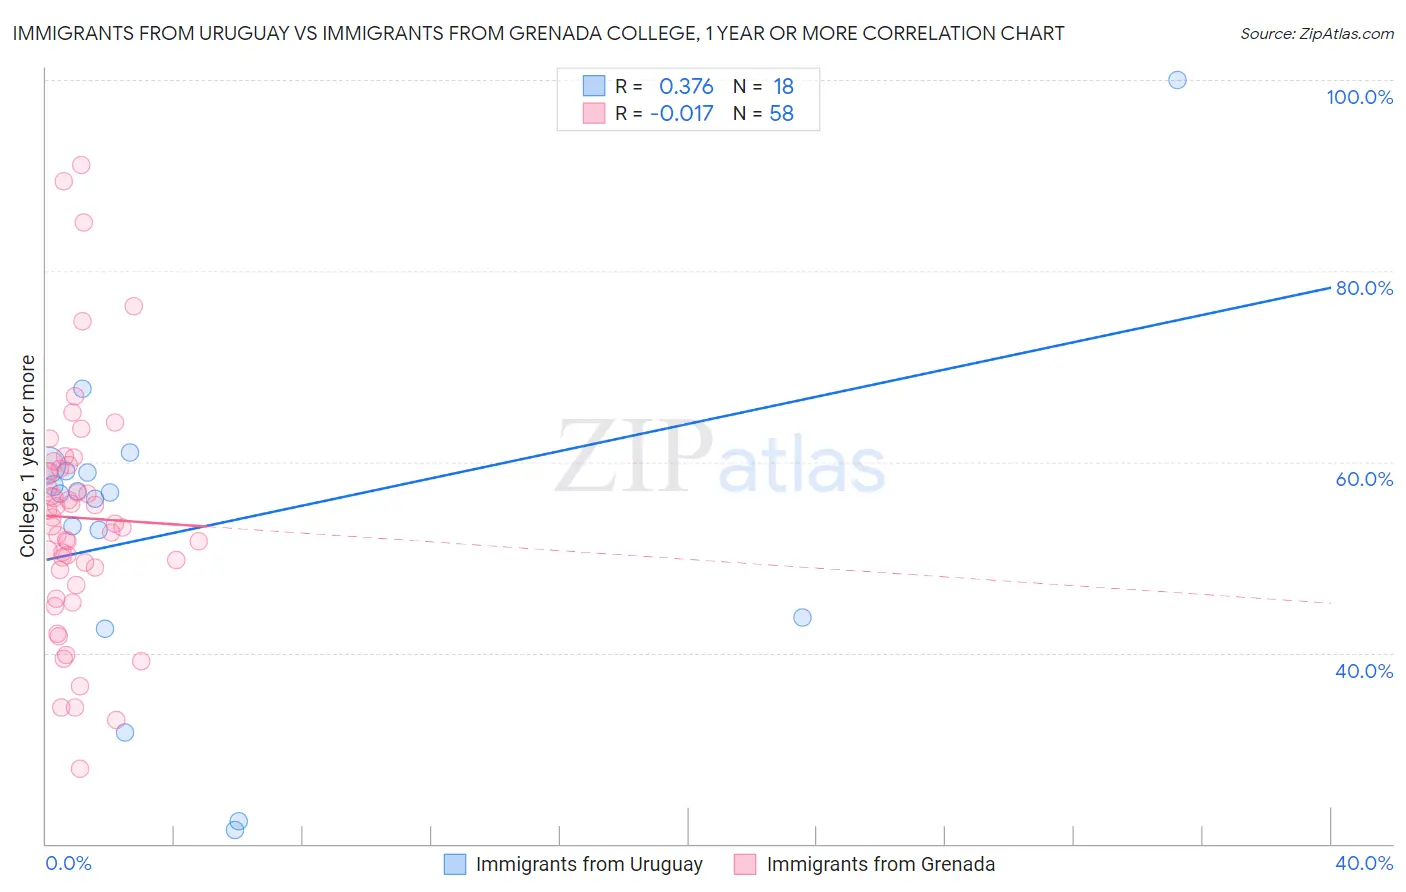
Immigrants from Uruguay vs Immigrants from Grenada College, 1 year or more Correlation Chart
The statistical analysis conducted on geographies consisting of 133,259,667 people shows a mild positive correlation between the proportion of Immigrants from Uruguay and percentage of population with at least college, 1 year or more education in the United States with a correlation coefficient (R) of 0.376 and weighted average of 58.1%. Similarly, the statistical analysis conducted on geographies consisting of 67,201,096 people shows no correlation between the proportion of Immigrants from Grenada and percentage of population with at least college, 1 year or more education in the United States with a correlation coefficient (R) of -0.017 and weighted average of 54.4%, a difference of 6.7%.
College, 1 year or more Correlation Summary
| Measurement | Immigrants from Uruguay | Immigrants from Grenada |
| Minimum | 21.5% | 27.9% |
| Maximum | 100.0% | 91.1% |
| Range | 78.5% | 63.3% |
| Mean | 53.2% | 54.1% |
| Median | 56.7% | 53.4% |
| Interquartile 25% (IQ1) | 43.8% | 48.7% |
| Interquartile 75% (IQ3) | 59.1% | 59.3% |
| Interquartile Range (IQR) | 15.3% | 10.6% |
| Standard Deviation (Sample) | 17.6% | 12.5% |
| Standard Deviation (Population) | 17.1% | 12.4% |
Similar Demographics by College, 1 year or more
Demographics Similar to Immigrants from Uruguay by College, 1 year or more
In terms of college, 1 year or more, the demographic groups most similar to Immigrants from Uruguay are Immigrants from Middle Africa (58.0%, a difference of 0.13%), Senegalese (58.2%, a difference of 0.17%), Tsimshian (57.9%, a difference of 0.19%), Immigrants from Nigeria (57.9%, a difference of 0.22%), and Immigrants from Vietnam (58.2%, a difference of 0.29%).
| Demographics | Rating | Rank | College, 1 year or more |
| Nigerians | 23.0 /100 | #201 | Fair 58.5% |
| Immigrants | South America | 21.9 /100 | #202 | Fair 58.4% |
| Ghanaians | 20.9 /100 | #203 | Fair 58.4% |
| Panamanians | 19.2 /100 | #204 | Poor 58.3% |
| Immigrants | Zaire | 18.7 /100 | #205 | Poor 58.3% |
| Immigrants | Vietnam | 18.2 /100 | #206 | Poor 58.2% |
| Senegalese | 16.9 /100 | #207 | Poor 58.2% |
| Immigrants | Uruguay | 15.2 /100 | #208 | Poor 58.1% |
| Immigrants | Middle Africa | 14.0 /100 | #209 | Poor 58.0% |
| Tsimshian | 13.5 /100 | #210 | Poor 57.9% |
| Immigrants | Nigeria | 13.3 /100 | #211 | Poor 57.9% |
| Immigrants | Senegal | 11.8 /100 | #212 | Poor 57.8% |
| French Canadians | 11.8 /100 | #213 | Poor 57.8% |
| Immigrants | Colombia | 11.6 /100 | #214 | Poor 57.8% |
| Tongans | 11.6 /100 | #215 | Poor 57.8% |
Demographics Similar to Immigrants from Grenada by College, 1 year or more
In terms of college, 1 year or more, the demographic groups most similar to Immigrants from Grenada are Comanche (54.4%, a difference of 0.040%), Belizean (54.4%, a difference of 0.040%), American (54.4%, a difference of 0.060%), Bahamian (54.5%, a difference of 0.080%), and Crow (54.5%, a difference of 0.11%).
| Demographics | Rating | Rank | College, 1 year or more |
| Potawatomi | 0.2 /100 | #266 | Tragic 54.6% |
| Blackfeet | 0.2 /100 | #267 | Tragic 54.6% |
| British West Indians | 0.2 /100 | #268 | Tragic 54.5% |
| Bangladeshis | 0.2 /100 | #269 | Tragic 54.5% |
| Crow | 0.2 /100 | #270 | Tragic 54.5% |
| Bahamians | 0.2 /100 | #271 | Tragic 54.5% |
| Comanche | 0.2 /100 | #272 | Tragic 54.4% |
| Immigrants | Grenada | 0.2 /100 | #273 | Tragic 54.4% |
| Belizeans | 0.2 /100 | #274 | Tragic 54.4% |
| Americans | 0.2 /100 | #275 | Tragic 54.4% |
| Shoshone | 0.2 /100 | #276 | Tragic 54.3% |
| Ecuadorians | 0.2 /100 | #277 | Tragic 54.3% |
| Immigrants | Jamaica | 0.1 /100 | #278 | Tragic 54.2% |
| Arapaho | 0.1 /100 | #279 | Tragic 54.1% |
| Cheyenne | 0.1 /100 | #280 | Tragic 54.1% |