Native/Alaskan vs Marshallese 12th Grade, No Diploma
COMPARE
Native/Alaskan
Marshallese
12th Grade, No Diploma
12th Grade, No Diploma Comparison
Natives/Alaskans
Marshallese
87.7%
12TH GRADE, NO DIPLOMA
0.0/ 100
METRIC RATING
306th/ 347
METRIC RANK
90.7%
12TH GRADE, NO DIPLOMA
18.2/ 100
METRIC RATING
202nd/ 347
METRIC RANK
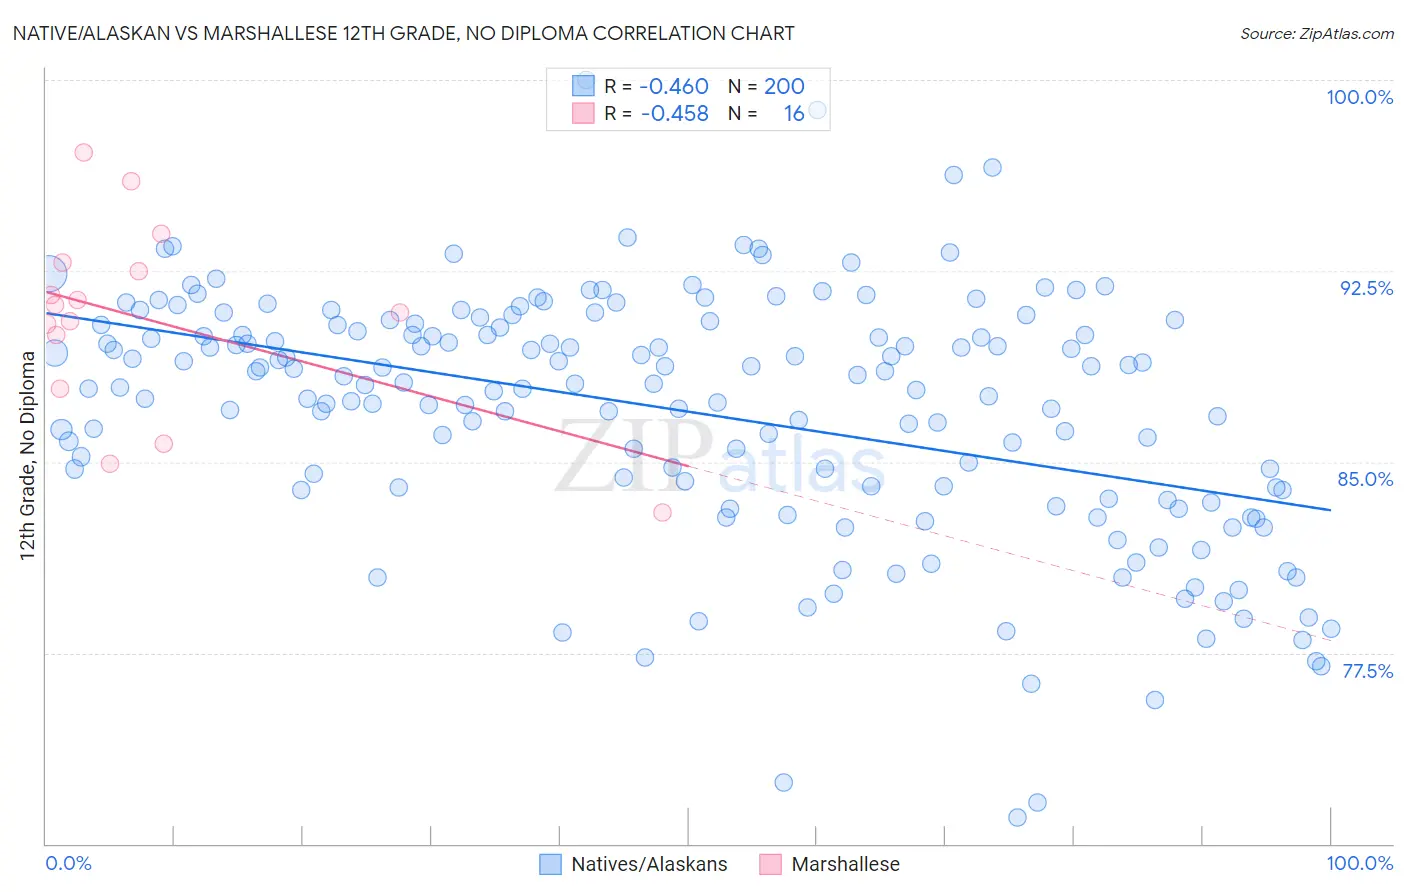
Native/Alaskan vs Marshallese 12th Grade, No Diploma Correlation Chart
The statistical analysis conducted on geographies consisting of 513,075,812 people shows a moderate negative correlation between the proportion of Natives/Alaskans and percentage of population with at least 12th grade (no diploma) education in the United States with a correlation coefficient (R) of -0.460 and weighted average of 87.7%. Similarly, the statistical analysis conducted on geographies consisting of 14,761,315 people shows a moderate negative correlation between the proportion of Marshallese and percentage of population with at least 12th grade (no diploma) education in the United States with a correlation coefficient (R) of -0.458 and weighted average of 90.7%, a difference of 3.5%.
12th Grade, No Diploma Correlation Summary
| Measurement | Native/Alaskan | Marshallese |
| Minimum | 71.1% | 83.0% |
| Maximum | 100.0% | 97.2% |
| Range | 28.9% | 14.1% |
| Mean | 87.0% | 90.6% |
| Median | 88.1% | 91.0% |
| Interquartile 25% (IQ1) | 83.9% | 88.9% |
| Interquartile 75% (IQ3) | 90.3% | 92.6% |
| Interquartile Range (IQR) | 6.4% | 3.7% |
| Standard Deviation (Sample) | 4.9% | 3.8% |
| Standard Deviation (Population) | 4.9% | 3.7% |
Similar Demographics by 12th Grade, No Diploma
Demographics Similar to Natives/Alaskans by 12th Grade, No Diploma
In terms of 12th grade, no diploma, the demographic groups most similar to Natives/Alaskans are Immigrants from Portugal (87.6%, a difference of 0.040%), Immigrants from Dominica (87.7%, a difference of 0.070%), Yup'ik (87.6%, a difference of 0.080%), Immigrants from Armenia (87.6%, a difference of 0.11%), and Immigrants from Cuba (87.5%, a difference of 0.16%).
| Demographics | Rating | Rank | 12th Grade, No Diploma |
| Nepalese | 0.0 /100 | #299 | Tragic 88.1% |
| Immigrants | Guyana | 0.0 /100 | #300 | Tragic 88.1% |
| Immigrants | Cambodia | 0.0 /100 | #301 | Tragic 88.1% |
| Ecuadorians | 0.0 /100 | #302 | Tragic 88.0% |
| Immigrants | Bangladesh | 0.0 /100 | #303 | Tragic 88.0% |
| Vietnamese | 0.0 /100 | #304 | Tragic 87.9% |
| Immigrants | Dominica | 0.0 /100 | #305 | Tragic 87.7% |
| Natives/Alaskans | 0.0 /100 | #306 | Tragic 87.7% |
| Immigrants | Portugal | 0.0 /100 | #307 | Tragic 87.6% |
| Yup'ik | 0.0 /100 | #308 | Tragic 87.6% |
| Immigrants | Armenia | 0.0 /100 | #309 | Tragic 87.6% |
| Immigrants | Cuba | 0.0 /100 | #310 | Tragic 87.5% |
| Yaqui | 0.0 /100 | #311 | Tragic 87.5% |
| Immigrants | Ecuador | 0.0 /100 | #312 | Tragic 87.5% |
| Immigrants | Caribbean | 0.0 /100 | #313 | Tragic 87.4% |
Demographics Similar to Marshallese by 12th Grade, No Diploma
In terms of 12th grade, no diploma, the demographic groups most similar to Marshallese are Immigrants from Southern Europe (90.8%, a difference of 0.030%), Liberian (90.8%, a difference of 0.030%), Hawaiian (90.8%, a difference of 0.030%), Samoan (90.8%, a difference of 0.040%), and Tongan (90.7%, a difference of 0.050%).
| Demographics | Rating | Rank | 12th Grade, No Diploma |
| Koreans | 24.5 /100 | #195 | Fair 90.8% |
| Panamanians | 22.8 /100 | #196 | Fair 90.8% |
| Immigrants | Sudan | 22.6 /100 | #197 | Fair 90.8% |
| Samoans | 20.4 /100 | #198 | Fair 90.8% |
| Immigrants | Southern Europe | 19.9 /100 | #199 | Poor 90.8% |
| Liberians | 19.8 /100 | #200 | Poor 90.8% |
| Hawaiians | 19.7 /100 | #201 | Poor 90.8% |
| Marshallese | 18.2 /100 | #202 | Poor 90.7% |
| Tongans | 16.1 /100 | #203 | Poor 90.7% |
| French American Indians | 15.5 /100 | #204 | Poor 90.7% |
| Immigrants | Sierra Leone | 14.9 /100 | #205 | Poor 90.7% |
| Immigrants | Bolivia | 12.3 /100 | #206 | Poor 90.6% |
| Armenians | 11.6 /100 | #207 | Poor 90.6% |
| Immigrants | Micronesia | 11.0 /100 | #208 | Poor 90.6% |
| Immigrants | Afghanistan | 11.0 /100 | #209 | Poor 90.6% |