Tlingit-Haida vs Menominee 12th Grade, No Diploma
COMPARE
Tlingit-Haida
Menominee
12th Grade, No Diploma
12th Grade, No Diploma Comparison
Tlingit-Haida
Menominee
93.0%
12TH GRADE, NO DIPLOMA
99.8/ 100
METRIC RATING
38th/ 347
METRIC RANK
91.9%
12TH GRADE, NO DIPLOMA
93.5/ 100
METRIC RATING
121st/ 347
METRIC RANK
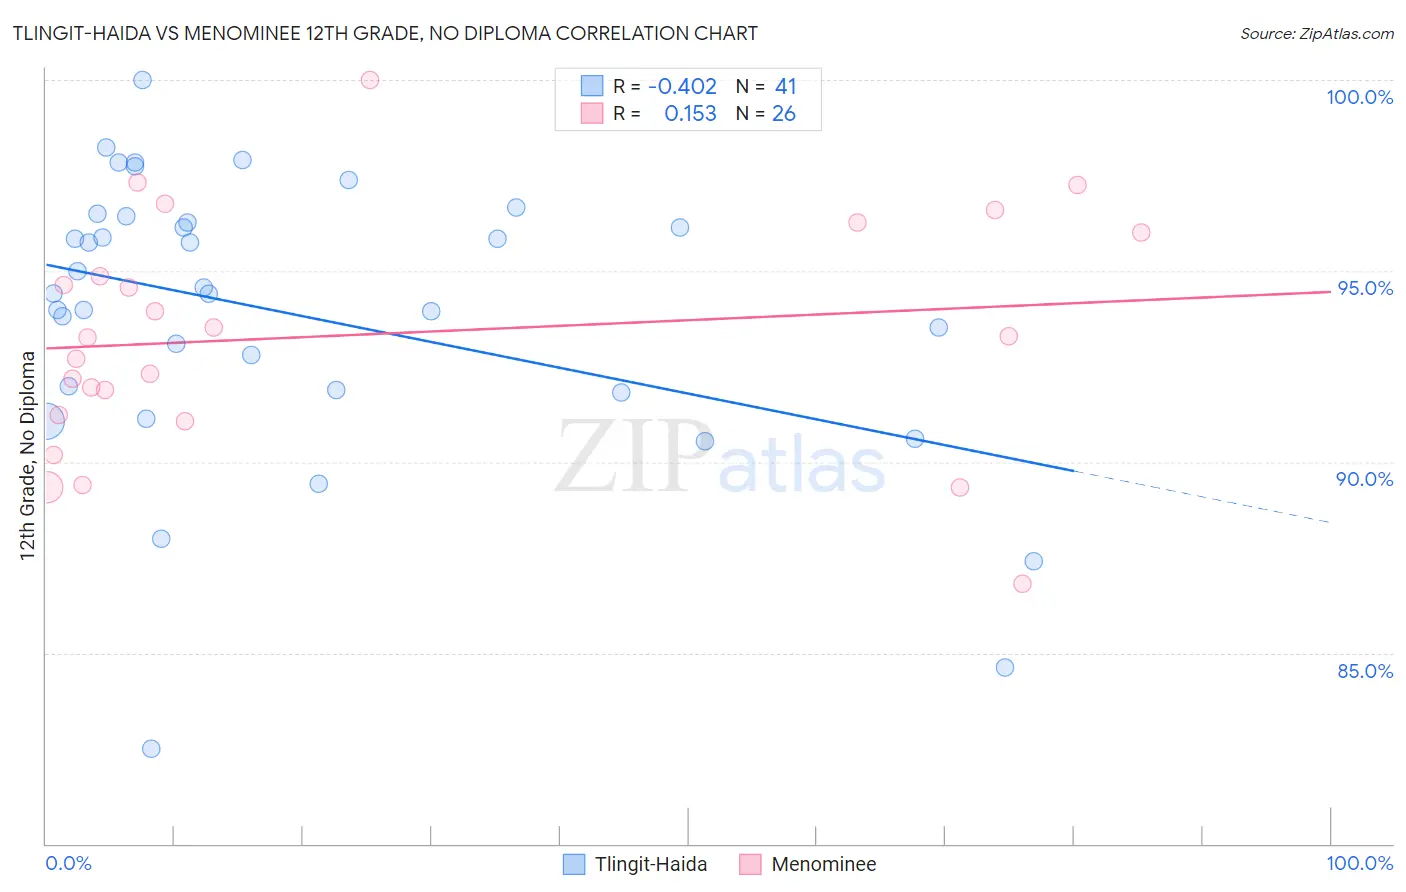
Tlingit-Haida vs Menominee 12th Grade, No Diploma Correlation Chart
The statistical analysis conducted on geographies consisting of 60,871,919 people shows a moderate negative correlation between the proportion of Tlingit-Haida and percentage of population with at least 12th grade (no diploma) education in the United States with a correlation coefficient (R) of -0.402 and weighted average of 93.0%. Similarly, the statistical analysis conducted on geographies consisting of 45,778,979 people shows a poor positive correlation between the proportion of Menominee and percentage of population with at least 12th grade (no diploma) education in the United States with a correlation coefficient (R) of 0.153 and weighted average of 91.9%, a difference of 1.1%.
12th Grade, No Diploma Correlation Summary
| Measurement | Tlingit-Haida | Menominee |
| Minimum | 82.5% | 86.8% |
| Maximum | 100.0% | 100.0% |
| Range | 17.5% | 13.2% |
| Mean | 93.9% | 93.3% |
| Median | 94.4% | 93.3% |
| Interquartile 25% (IQ1) | 91.8% | 91.2% |
| Interquartile 75% (IQ3) | 96.3% | 96.0% |
| Interquartile Range (IQR) | 4.5% | 4.8% |
| Standard Deviation (Sample) | 3.7% | 3.1% |
| Standard Deviation (Population) | 3.7% | 3.0% |
Similar Demographics by 12th Grade, No Diploma
Demographics Similar to Tlingit-Haida by 12th Grade, No Diploma
In terms of 12th grade, no diploma, the demographic groups most similar to Tlingit-Haida are Immigrants from Austria (93.0%, a difference of 0.010%), Turkish (93.0%, a difference of 0.010%), Bhutanese (93.0%, a difference of 0.010%), Scottish (93.0%, a difference of 0.030%), and Irish (93.0%, a difference of 0.030%).
| Demographics | Rating | Rank | 12th Grade, No Diploma |
| Immigrants | Ireland | 99.9 /100 | #31 | Exceptional 93.1% |
| Europeans | 99.9 /100 | #32 | Exceptional 93.1% |
| Immigrants | Scotland | 99.9 /100 | #33 | Exceptional 93.0% |
| Okinawans | 99.9 /100 | #34 | Exceptional 93.0% |
| English | 99.9 /100 | #35 | Exceptional 93.0% |
| Scottish | 99.9 /100 | #36 | Exceptional 93.0% |
| Irish | 99.9 /100 | #37 | Exceptional 93.0% |
| Tlingit-Haida | 99.8 /100 | #38 | Exceptional 93.0% |
| Immigrants | Austria | 99.8 /100 | #39 | Exceptional 93.0% |
| Turks | 99.8 /100 | #40 | Exceptional 93.0% |
| Bhutanese | 99.8 /100 | #41 | Exceptional 93.0% |
| Immigrants | Australia | 99.8 /100 | #42 | Exceptional 92.9% |
| Northern Europeans | 99.8 /100 | #43 | Exceptional 92.9% |
| Dutch | 99.8 /100 | #44 | Exceptional 92.9% |
| Greeks | 99.8 /100 | #45 | Exceptional 92.9% |
Demographics Similar to Menominee by 12th Grade, No Diploma
In terms of 12th grade, no diploma, the demographic groups most similar to Menominee are Ottawa (91.9%, a difference of 0.020%), Immigrants from Kazakhstan (91.9%, a difference of 0.030%), Egyptian (91.9%, a difference of 0.050%), Immigrants from Ukraine (91.8%, a difference of 0.090%), and White/Caucasian (91.8%, a difference of 0.090%).
| Demographics | Rating | Rank | 12th Grade, No Diploma |
| Yugoslavians | 96.5 /100 | #114 | Exceptional 92.1% |
| Immigrants | Sri Lanka | 96.4 /100 | #115 | Exceptional 92.1% |
| Aleuts | 96.3 /100 | #116 | Exceptional 92.1% |
| Immigrants | Eastern Europe | 96.3 /100 | #117 | Exceptional 92.1% |
| Puget Sound Salish | 95.8 /100 | #118 | Exceptional 92.0% |
| Immigrants | Germany | 95.5 /100 | #119 | Exceptional 92.0% |
| Immigrants | Kazakhstan | 94.2 /100 | #120 | Exceptional 91.9% |
| Menominee | 93.5 /100 | #121 | Exceptional 91.9% |
| Ottawa | 93.1 /100 | #122 | Exceptional 91.9% |
| Egyptians | 92.5 /100 | #123 | Exceptional 91.9% |
| Immigrants | Ukraine | 91.6 /100 | #124 | Exceptional 91.8% |
| Whites/Caucasians | 91.6 /100 | #125 | Exceptional 91.8% |
| Basques | 91.3 /100 | #126 | Exceptional 91.8% |
| Immigrants | Jordan | 91.0 /100 | #127 | Exceptional 91.8% |
| Mongolians | 89.9 /100 | #128 | Excellent 91.8% |