Subsaharan African vs Marshallese 12th Grade, No Diploma

COMPARE

Subsaharan African
Race
Ancestry
AfghanAfricanAlaska NativeAlaskan AthabascanAlbanianAleutAlsatianAmericanApacheArabArapahoArgentineanArmenianAssyrian/Chaldean/SyriacAustralianAustrianBahamianBangladeshiBarbadianBasqueBelgianBelizeanBermudanBhutaneseBlackfeetBolivianBrazilianBritishBritish West IndianBulgarianBurmeseCajunCambodianCanadianCape VerdeanCarpatho RusynCelticCentral AmericanCentral American IndianCherokeeCheyenneChickasawChileanChineseChippewaChoctawColombianColvilleComancheCosta RicanCreeCreekCroatianCrowCubanCypriotCzechCzechoslovakianDanishDelawareDominicanDutchDutch West IndianEastern EuropeanEcuadorianEgyptianEnglishEstonianEthiopianEuropeanFijianFilipinoFinnishFrenchFrench American IndianFrench CanadianGermanGerman RussianGhanaianGreekGuamanian/ChamorroGuatemalanGuyaneseHaitianHmongHonduranHopiHoumaHungarianIcelanderIndian (Asian)IndonesianInupiatIranianIraqiIrishIroquoisIsraeliItalianJamaicanJapaneseJordanianKenyanKiowaKoreanLaotianLatvianLebaneseLiberianLithuanianLumbeeLuxembourgerMacedonianMalaysianMalteseMenomineeMexicanMexican American IndianMongolianMoroccanNative HawaiianNavajoNepaleseNew ZealanderNicaraguanNigerianNorthern EuropeanNorwegianOkinawanOsageOttawaPaiutePakistaniPalestinianPanamanianParaguayanPennsylvania GermanPeruvianPimaPolishPortuguesePotawatomiPuebloPuerto RicanPuget Sound SalishRomanianRussianSalvadoranSamoanScandinavianScotch-IrishScottishSeminoleSenegaleseSerbianShoshoneSierra LeoneanSiouxSlavicSlovakSloveneSomaliSouth AfricanSouth AmericanSouth American IndianSoviet UnionSpaniardSpanishSpanish AmericanSpanish American IndianSri LankanSubsaharan AfricanSudaneseSwedishSwissSyrianTaiwaneseThaiTlingit-HaidaTohono O'OdhamTonganTrinidadian and TobagonianTsimshianTurkishU.S. Virgin IslanderUgandanUkrainianUruguayanUteVenezuelanVietnameseWelshWest IndianYakamaYaquiYugoslavianYumanYup'ikZimbabwean
Immigration
NonimmigrantsImmigrantsAfghanistanAfricaAlbaniaArgentinaArmeniaAsiaAustraliaAustriaBahamasBangladeshBarbadosBelarusBelgiumBelizeBoliviaBosnia and HerzegovinaBrazilBulgariaBurma/MyanmarCabo VerdeCambodiaCameroonCanadaCaribbeanCentral AmericaChileChinaColombiaCongoCosta RicaCroatiaCubaCzechoslovakiaDenmarkDominicaDominican RepublicEastern AfricaEastern AsiaEastern EuropeEcuadorEgyptEl SalvadorEnglandEritreaEthiopiaEuropeFijiFranceGermanyGhanaGreeceGrenadaGuatemalaGuyanaHaitiHondurasHong KongHungaryIndiaIndonesiaIranIraqIrelandIsraelItalyJamaicaJapanJordanKazakhstanKenyaKoreaKuwaitLaosLatin AmericaLatviaLebanonLiberiaLithuaniaMalaysiaMexicoMicronesiaMiddle AfricaMoldovaMoroccoNepalNetherlandsNicaraguaNigeriaNorth AmericaNorth MacedoniaNorthern AfricaNorthern EuropeNorwayOceaniaPakistanPanamaPeruPhilippinesPolandPortugalRomaniaRussiaSaudi ArabiaScotlandSenegalSerbiaSierra LeoneSingaporeSomaliaSouth AfricaSouth AmericaSouth Central AsiaSouth Eastern AsiaSouthern EuropeSpainSri LankaSt. Vincent and the GrenadinesSudanSwedenSwitzerlandSyriaTaiwanThailandTrinidad and TobagoTurkeyUgandaUkraineUruguayUzbekistanVenezuelaVietnamWest IndiesWestern AfricaWestern AsiaWestern EuropeYemenZaireZimbabweAzores
Marshallese
Race
Ancestry
AfghanAfricanAlaska NativeAlaskan AthabascanAlbanianAleutAlsatianAmericanApacheArabArapahoArgentineanArmenianAssyrian/Chaldean/SyriacAustralianAustrianBahamianBangladeshiBarbadianBasqueBelgianBelizeanBermudanBhutaneseBlackfeetBolivianBrazilianBritishBritish West IndianBulgarianBurmeseCajunCambodianCanadianCape VerdeanCarpatho RusynCelticCentral AmericanCentral American IndianCherokeeCheyenneChickasawChileanChineseChippewaChoctawColombianColvilleComancheCosta RicanCreeCreekCroatianCrowCubanCypriotCzechCzechoslovakianDanishDelawareDominicanDutchDutch West IndianEastern EuropeanEcuadorianEgyptianEnglishEstonianEthiopianEuropeanFijianFilipinoFinnishFrenchFrench American IndianFrench CanadianGermanGerman RussianGhanaianGreekGuamanian/ChamorroGuatemalanGuyaneseHaitianHmongHonduranHopiHoumaHungarianIcelanderIndian (Asian)IndonesianInupiatIranianIraqiIrishIroquoisIsraeliItalianJamaicanJapaneseJordanianKenyanKiowaKoreanLaotianLatvianLebaneseLiberianLithuanianLumbeeLuxembourgerMacedonianMalaysianMalteseMarshalleseMenomineeMexicanMexican American IndianMongolianMoroccanNative HawaiianNavajoNepaleseNew ZealanderNicaraguanNigerianNorthern EuropeanNorwegianOkinawanOsageOttawaPaiutePakistaniPalestinianPanamanianParaguayanPennsylvania GermanPeruvianPimaPolishPortuguesePotawatomiPuebloPuerto RicanPuget Sound SalishRomanianRussianSalvadoranSamoanScandinavianScotch-IrishScottishSeminoleSenegaleseSerbianShoshoneSierra LeoneanSiouxSlavicSlovakSloveneSomaliSouth AfricanSouth AmericanSouth American IndianSoviet UnionSpaniardSpanishSpanish AmericanSpanish American IndianSri LankanSudaneseSwedishSwissSyrianTaiwaneseThaiTlingit-HaidaTohono O'OdhamTonganTrinidadian and TobagonianTsimshianTurkishU.S. Virgin IslanderUgandanUkrainianUruguayanUteVenezuelanVietnameseWelshWest IndianYakamaYaquiYugoslavianYumanYup'ikZimbabwean
Immigration
NonimmigrantsImmigrantsAfghanistanAfricaAlbaniaArgentinaArmeniaAsiaAustraliaAustriaBahamasBangladeshBarbadosBelarusBelgiumBelizeBoliviaBosnia and HerzegovinaBrazilBulgariaBurma/MyanmarCabo VerdeCambodiaCameroonCanadaCaribbeanCentral AmericaChileChinaColombiaCongoCosta RicaCroatiaCubaCzechoslovakiaDenmarkDominicaDominican RepublicEastern AfricaEastern AsiaEastern EuropeEcuadorEgyptEl SalvadorEnglandEritreaEthiopiaEuropeFijiFranceGermanyGhanaGreeceGrenadaGuatemalaGuyanaHaitiHondurasHong KongHungaryIndiaIndonesiaIranIraqIrelandIsraelItalyJamaicaJapanJordanKazakhstanKenyaKoreaKuwaitLaosLatin AmericaLatviaLebanonLiberiaLithuaniaMalaysiaMexicoMicronesiaMiddle AfricaMoldovaMoroccoNepalNetherlandsNicaraguaNigeriaNorth AmericaNorth MacedoniaNorthern AfricaNorthern EuropeNorwayOceaniaPakistanPanamaPeruPhilippinesPolandPortugalRomaniaRussiaSaudi ArabiaScotlandSenegalSerbiaSierra LeoneSingaporeSomaliaSouth AfricaSouth AmericaSouth Central AsiaSouth Eastern AsiaSouthern EuropeSpainSri LankaSt. Vincent and the GrenadinesSudanSwedenSwitzerlandSyriaTaiwanThailandTrinidad and TobagoTurkeyUgandaUkraineUruguayUzbekistanVenezuelaVietnamWest IndiesWestern AfricaWestern AsiaWestern EuropeYemenZaireZimbabweAzores
12th Grade, No Diploma
Income
Poverty
Unemployment
Labor Participation
Family Structure
Vehicle Availability
Education Level
Disability

12th Grade, No Diploma Comparison

Sub-Saharan Africans

Marshallese

Tragic
Poor
90.1%
12TH GRADE, NO DIPLOMA
1.9/ 100
METRIC RATING
239th/ 347
METRIC RANK
90.7%
12TH GRADE, NO DIPLOMA
18.2/ 100
METRIC RATING
202nd/ 347
METRIC RANK

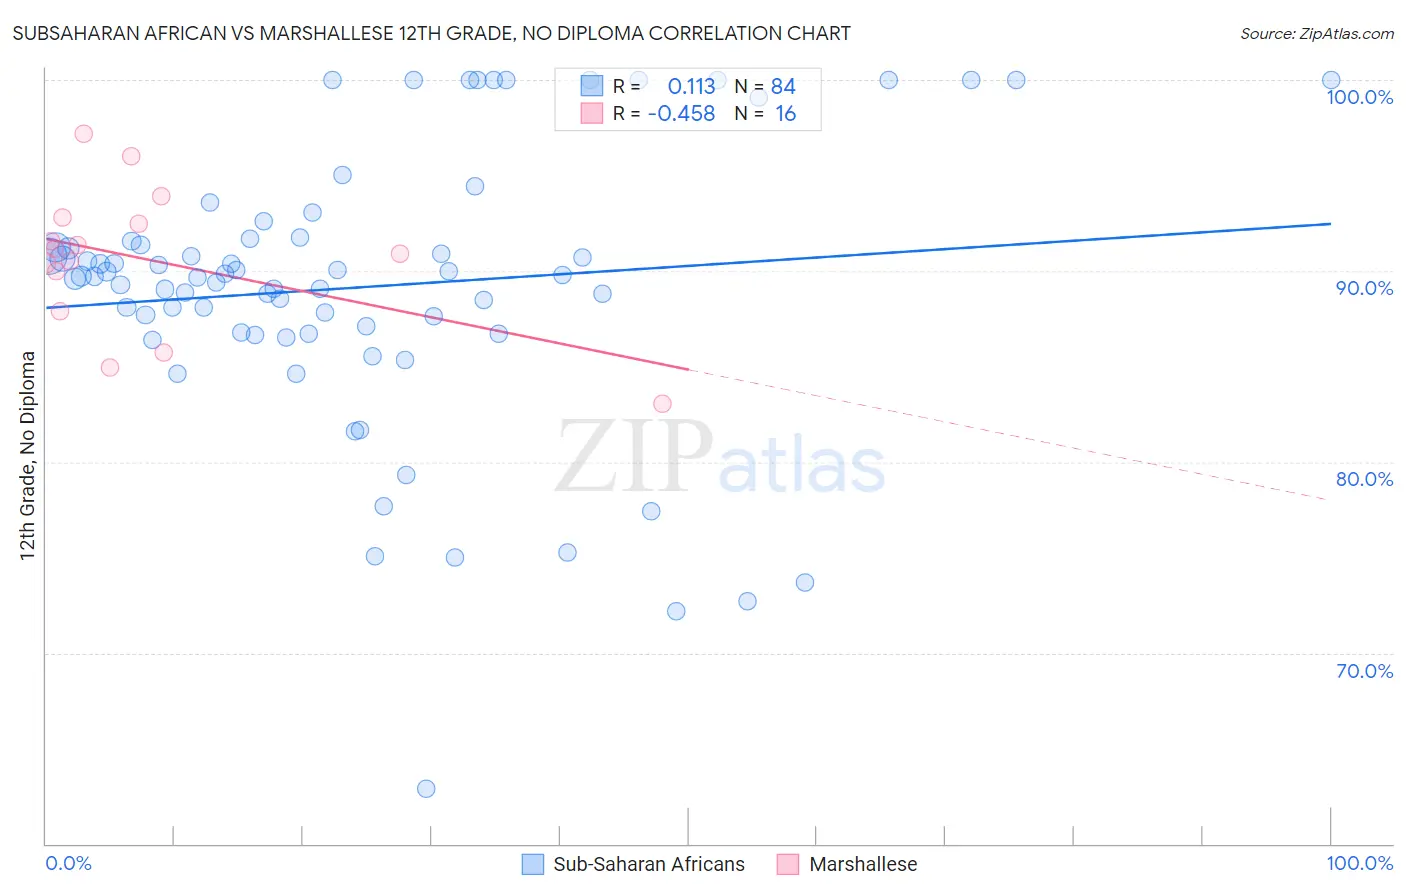
Subsaharan African vs Marshallese 12th Grade, No Diploma Correlation Chart

The statistical analysis conducted on geographies consisting of 508,219,008 people shows a poor positive correlation between the proportion of Sub-Saharan Africans and percentage of population with at least 12th grade (no diploma) education in the United States with a correlation coefficient (R) of 0.113 and weighted average of 90.1%. Similarly, the statistical analysis conducted on geographies consisting of 14,761,315 people shows a moderate negative correlation between the proportion of Marshallese and percentage of population with at least 12th grade (no diploma) education in the United States with a correlation coefficient (R) of -0.458 and weighted average of 90.7%, a difference of 0.76%.
Subsaharan African vs Marshallese 12th Grade, No Diploma

12th Grade, No Diploma Correlation Summary

MeasurementSubsaharan AfricanMarshallese
Minimum62.8%83.0%
Maximum100.0%97.2%
Range37.2%14.1%
Mean89.2%90.6%
Median89.7%91.0%
Interquartile 25% (IQ1)86.7%88.9%
Interquartile 75% (IQ3)91.6%92.6%
Interquartile Range (IQR)4.9%3.7%
Standard Deviation (Sample)7.3%3.8%
Standard Deviation (Population)7.3%3.7%

Similar Demographics by 12th Grade, No Diploma

Demographics Similar to Sub-Saharan Africans by 12th Grade, No Diploma

In terms of 12th grade, no diploma, the demographic groups most similar to Sub-Saharan Africans are Inupiat (90.1%, a difference of 0.020%), Kiowa (90.0%, a difference of 0.020%), Immigrants from Colombia (90.1%, a difference of 0.030%), Immigrants from Middle Africa (90.0%, a difference of 0.030%), and Immigrants from Uzbekistan (90.1%, a difference of 0.050%).
DemographicsRating | Rank12th Grade, No Diploma
Blackfeet
2.4
/100
|
#232
Tragic
90.1%
Immigrants | Thailand
2.3
/100
|
#233
Tragic
90.1%
Immigrants | South America
2.3
/100
|
#234
Tragic
90.1%
Colville
2.3
/100
|
#235
Tragic
90.1%
Immigrants | Uzbekistan
2.2
/100
|
#236
Tragic
90.1%
Immigrants | Colombia
2.1
/100
|
#237
Tragic
90.1%
Inupiat
2.0
/100
|
#238
Tragic
90.1%
Sub-Saharan Africans
1.9
/100
|
#239
Tragic
90.1%
Kiowa
1.7
/100
|
#240
Tragic
90.0%
Immigrants | Middle Africa
1.7
/100
|
#241
Tragic
90.0%
Immigrants | Costa Rica
1.6
/100
|
#242
Tragic
90.0%
Crow
1.5
/100
|
#243
Tragic
90.0%
Taiwanese
1.5
/100
|
#244
Tragic
90.0%
Immigrants | Uruguay
1.4
/100
|
#245
Tragic
90.0%
Ghanaians
1.3
/100
|
#246
Tragic
90.0%

Demographics Similar to Marshallese by 12th Grade, No Diploma

In terms of 12th grade, no diploma, the demographic groups most similar to Marshallese are Immigrants from Southern Europe (90.8%, a difference of 0.030%), Liberian (90.8%, a difference of 0.030%), Hawaiian (90.8%, a difference of 0.030%), Samoan (90.8%, a difference of 0.040%), and Tongan (90.7%, a difference of 0.050%).
DemographicsRating | Rank12th Grade, No Diploma
Koreans
24.5
/100
|
#195
Fair
90.8%
Panamanians
22.8
/100
|
#196
Fair
90.8%
Immigrants | Sudan
22.6
/100
|
#197
Fair
90.8%
Samoans
20.4
/100
|
#198
Fair
90.8%
Immigrants | Southern Europe
19.9
/100
|
#199
Poor
90.8%
Liberians
19.8
/100
|
#200
Poor
90.8%
Hawaiians
19.7
/100
|
#201
Poor
90.8%
Marshallese
18.2
/100
|
#202
Poor
90.7%
Tongans
16.1
/100
|
#203
Poor
90.7%
French American Indians
15.5
/100
|
#204
Poor
90.7%
Immigrants | Sierra Leone
14.9
/100
|
#205
Poor
90.7%
Immigrants | Bolivia
12.3
/100
|
#206
Poor
90.6%
Armenians
11.6
/100
|
#207
Poor
90.6%
Immigrants | Micronesia
11.0
/100
|
#208
Poor
90.6%
Immigrants | Afghanistan
11.0
/100
|
#209
Poor
90.6%