Tlingit-Haida vs Immigrants from Netherlands 12th Grade, No Diploma
COMPARE
Tlingit-Haida
Immigrants from Netherlands
12th Grade, No Diploma
12th Grade, No Diploma Comparison
Tlingit-Haida
Immigrants from Netherlands
93.0%
12TH GRADE, NO DIPLOMA
99.8/ 100
METRIC RATING
38th/ 347
METRIC RANK
92.7%
12TH GRADE, NO DIPLOMA
99.6/ 100
METRIC RATING
64th/ 347
METRIC RANK
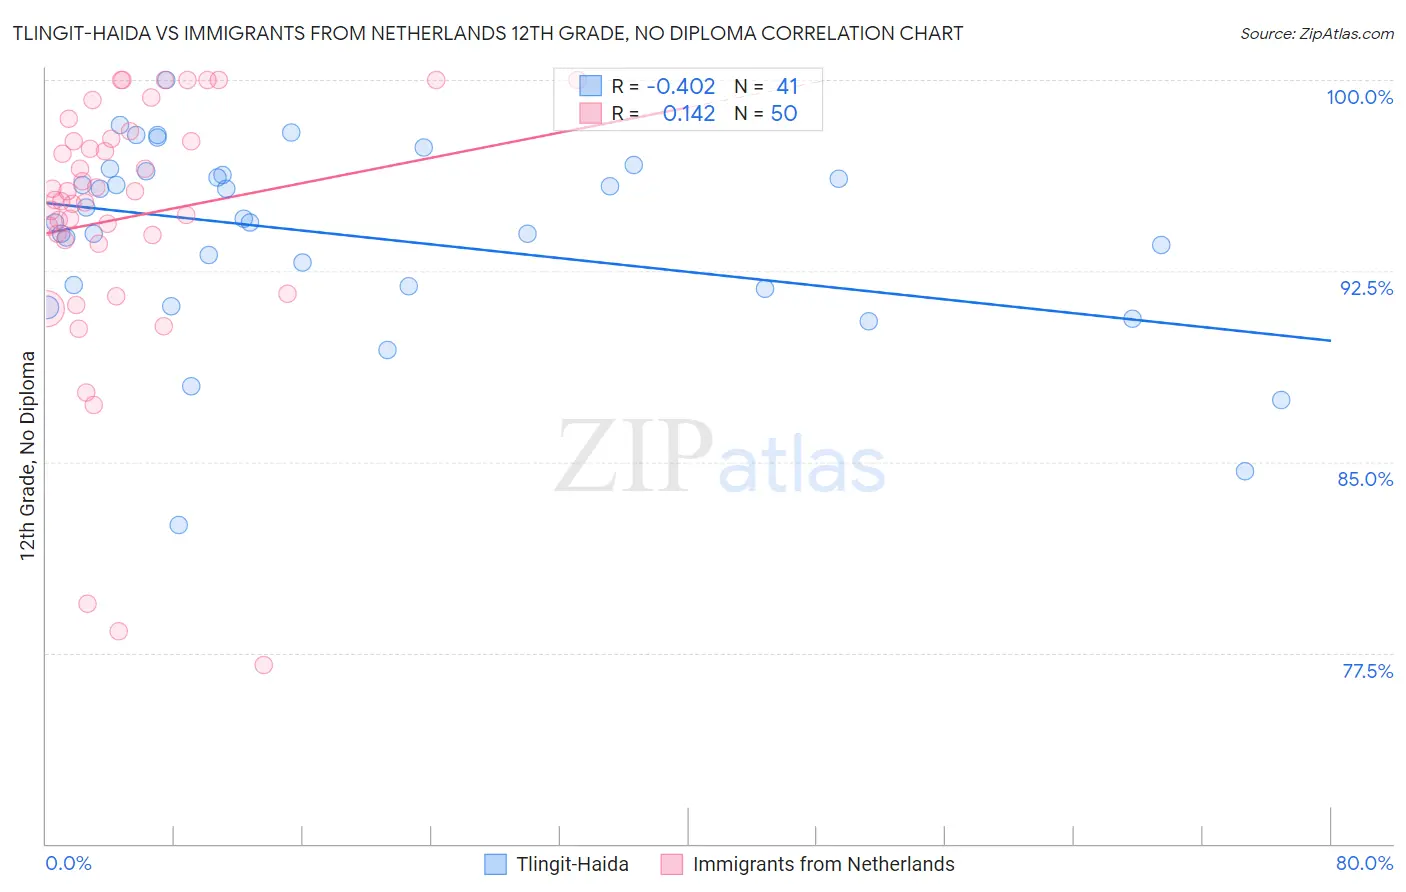
Tlingit-Haida vs Immigrants from Netherlands 12th Grade, No Diploma Correlation Chart
The statistical analysis conducted on geographies consisting of 60,871,919 people shows a moderate negative correlation between the proportion of Tlingit-Haida and percentage of population with at least 12th grade (no diploma) education in the United States with a correlation coefficient (R) of -0.402 and weighted average of 93.0%. Similarly, the statistical analysis conducted on geographies consisting of 237,877,180 people shows a poor positive correlation between the proportion of Immigrants from Netherlands and percentage of population with at least 12th grade (no diploma) education in the United States with a correlation coefficient (R) of 0.142 and weighted average of 92.7%, a difference of 0.28%.
12th Grade, No Diploma Correlation Summary
| Measurement | Tlingit-Haida | Immigrants from Netherlands |
| Minimum | 82.5% | 77.0% |
| Maximum | 100.0% | 100.0% |
| Range | 17.5% | 23.0% |
| Mean | 93.9% | 94.6% |
| Median | 94.4% | 95.5% |
| Interquartile 25% (IQ1) | 91.8% | 93.7% |
| Interquartile 75% (IQ3) | 96.3% | 97.7% |
| Interquartile Range (IQR) | 4.5% | 4.0% |
| Standard Deviation (Sample) | 3.7% | 5.3% |
| Standard Deviation (Population) | 3.7% | 5.2% |
Similar Demographics by 12th Grade, No Diploma
Demographics Similar to Tlingit-Haida by 12th Grade, No Diploma
In terms of 12th grade, no diploma, the demographic groups most similar to Tlingit-Haida are Immigrants from Austria (93.0%, a difference of 0.010%), Turkish (93.0%, a difference of 0.010%), Bhutanese (93.0%, a difference of 0.010%), Scottish (93.0%, a difference of 0.030%), and Irish (93.0%, a difference of 0.030%).
| Demographics | Rating | Rank | 12th Grade, No Diploma |
| Immigrants | Ireland | 99.9 /100 | #31 | Exceptional 93.1% |
| Europeans | 99.9 /100 | #32 | Exceptional 93.1% |
| Immigrants | Scotland | 99.9 /100 | #33 | Exceptional 93.0% |
| Okinawans | 99.9 /100 | #34 | Exceptional 93.0% |
| English | 99.9 /100 | #35 | Exceptional 93.0% |
| Scottish | 99.9 /100 | #36 | Exceptional 93.0% |
| Irish | 99.9 /100 | #37 | Exceptional 93.0% |
| Tlingit-Haida | 99.8 /100 | #38 | Exceptional 93.0% |
| Immigrants | Austria | 99.8 /100 | #39 | Exceptional 93.0% |
| Turks | 99.8 /100 | #40 | Exceptional 93.0% |
| Bhutanese | 99.8 /100 | #41 | Exceptional 93.0% |
| Immigrants | Australia | 99.8 /100 | #42 | Exceptional 92.9% |
| Northern Europeans | 99.8 /100 | #43 | Exceptional 92.9% |
| Dutch | 99.8 /100 | #44 | Exceptional 92.9% |
| Greeks | 99.8 /100 | #45 | Exceptional 92.9% |
Demographics Similar to Immigrants from Netherlands by 12th Grade, No Diploma
In terms of 12th grade, no diploma, the demographic groups most similar to Immigrants from Netherlands are Zimbabwean (92.7%, a difference of 0.0%), Austrian (92.7%, a difference of 0.0%), Ukrainian (92.7%, a difference of 0.030%), Soviet Union (92.7%, a difference of 0.030%), and Immigrants from Japan (92.8%, a difference of 0.050%).
| Demographics | Rating | Rank | 12th Grade, No Diploma |
| Immigrants | Canada | 99.7 /100 | #57 | Exceptional 92.8% |
| Immigrants | Taiwan | 99.7 /100 | #58 | Exceptional 92.8% |
| Immigrants | North America | 99.7 /100 | #59 | Exceptional 92.8% |
| Slavs | 99.7 /100 | #60 | Exceptional 92.8% |
| Immigrants | Japan | 99.7 /100 | #61 | Exceptional 92.8% |
| Ukrainians | 99.6 /100 | #62 | Exceptional 92.7% |
| Zimbabweans | 99.6 /100 | #63 | Exceptional 92.7% |
| Immigrants | Netherlands | 99.6 /100 | #64 | Exceptional 92.7% |
| Austrians | 99.6 /100 | #65 | Exceptional 92.7% |
| Soviet Union | 99.6 /100 | #66 | Exceptional 92.7% |
| Immigrants | South Africa | 99.5 /100 | #67 | Exceptional 92.7% |
| Immigrants | Czechoslovakia | 99.5 /100 | #68 | Exceptional 92.7% |
| Immigrants | Iran | 99.5 /100 | #69 | Exceptional 92.7% |
| Czechoslovakians | 99.5 /100 | #70 | Exceptional 92.6% |
| Immigrants | Latvia | 99.5 /100 | #71 | Exceptional 92.6% |