Tlingit-Haida vs Guatemalan 12th Grade, No Diploma
COMPARE
Tlingit-Haida
Guatemalan
12th Grade, No Diploma
12th Grade, No Diploma Comparison
Tlingit-Haida
Guatemalans
93.0%
12TH GRADE, NO DIPLOMA
99.8/ 100
METRIC RATING
38th/ 347
METRIC RANK
84.6%
12TH GRADE, NO DIPLOMA
0.0/ 100
METRIC RATING
338th/ 347
METRIC RANK
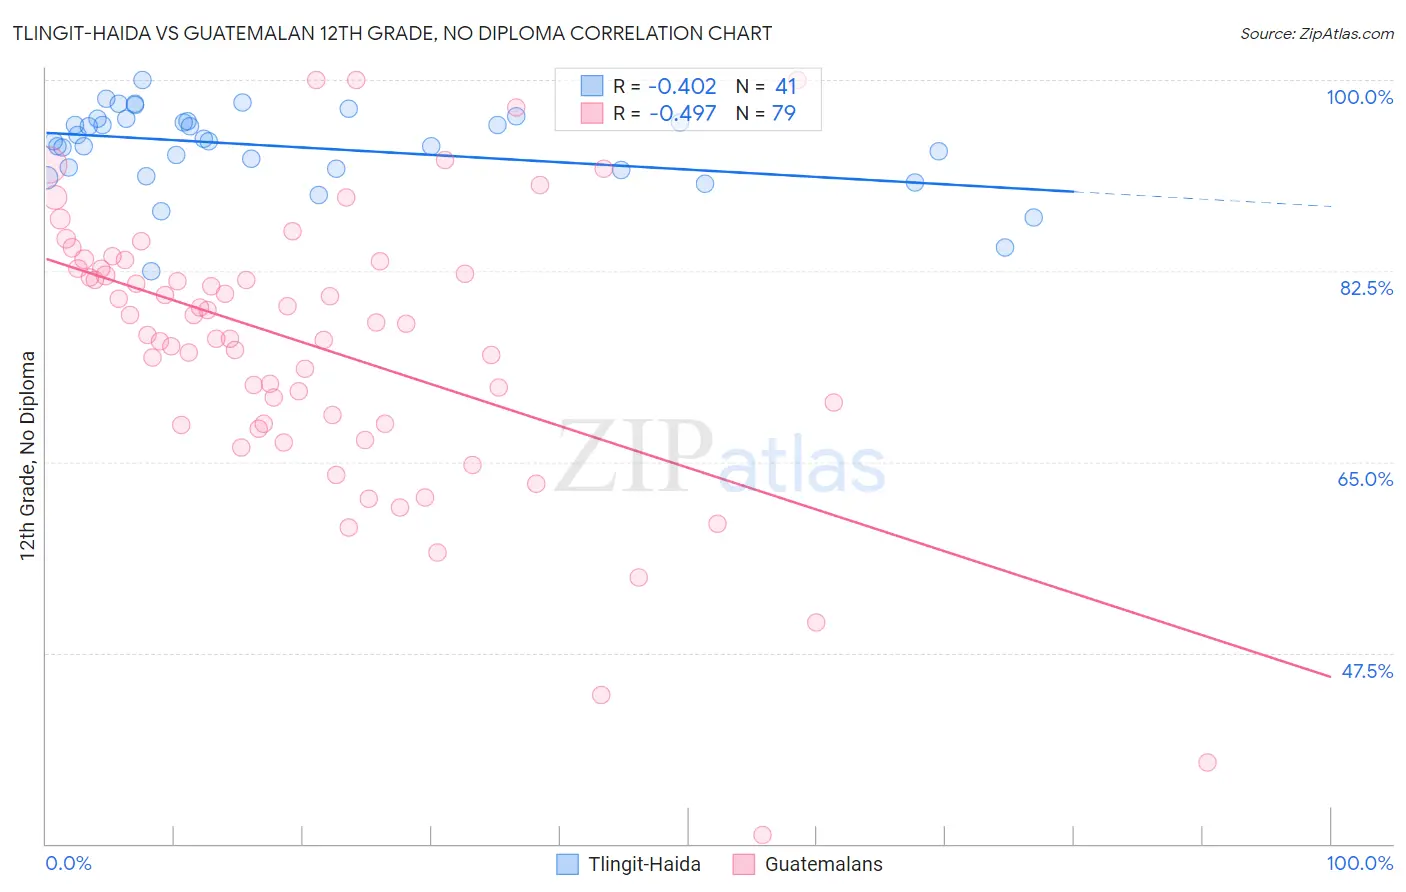
Tlingit-Haida vs Guatemalan 12th Grade, No Diploma Correlation Chart
The statistical analysis conducted on geographies consisting of 60,871,919 people shows a moderate negative correlation between the proportion of Tlingit-Haida and percentage of population with at least 12th grade (no diploma) education in the United States with a correlation coefficient (R) of -0.402 and weighted average of 93.0%. Similarly, the statistical analysis conducted on geographies consisting of 409,566,618 people shows a moderate negative correlation between the proportion of Guatemalans and percentage of population with at least 12th grade (no diploma) education in the United States with a correlation coefficient (R) of -0.497 and weighted average of 84.6%, a difference of 10.0%.
12th Grade, No Diploma Correlation Summary
| Measurement | Tlingit-Haida | Guatemalan |
| Minimum | 82.5% | 30.8% |
| Maximum | 100.0% | 100.0% |
| Range | 17.5% | 69.2% |
| Mean | 93.9% | 75.5% |
| Median | 94.4% | 77.7% |
| Interquartile 25% (IQ1) | 91.8% | 68.5% |
| Interquartile 75% (IQ3) | 96.3% | 82.7% |
| Interquartile Range (IQR) | 4.5% | 14.3% |
| Standard Deviation (Sample) | 3.7% | 13.0% |
| Standard Deviation (Population) | 3.7% | 12.9% |
Similar Demographics by 12th Grade, No Diploma
Demographics Similar to Tlingit-Haida by 12th Grade, No Diploma
In terms of 12th grade, no diploma, the demographic groups most similar to Tlingit-Haida are Immigrants from Austria (93.0%, a difference of 0.010%), Turkish (93.0%, a difference of 0.010%), Bhutanese (93.0%, a difference of 0.010%), Scottish (93.0%, a difference of 0.030%), and Irish (93.0%, a difference of 0.030%).
| Demographics | Rating | Rank | 12th Grade, No Diploma |
| Immigrants | Ireland | 99.9 /100 | #31 | Exceptional 93.1% |
| Europeans | 99.9 /100 | #32 | Exceptional 93.1% |
| Immigrants | Scotland | 99.9 /100 | #33 | Exceptional 93.0% |
| Okinawans | 99.9 /100 | #34 | Exceptional 93.0% |
| English | 99.9 /100 | #35 | Exceptional 93.0% |
| Scottish | 99.9 /100 | #36 | Exceptional 93.0% |
| Irish | 99.9 /100 | #37 | Exceptional 93.0% |
| Tlingit-Haida | 99.8 /100 | #38 | Exceptional 93.0% |
| Immigrants | Austria | 99.8 /100 | #39 | Exceptional 93.0% |
| Turks | 99.8 /100 | #40 | Exceptional 93.0% |
| Bhutanese | 99.8 /100 | #41 | Exceptional 93.0% |
| Immigrants | Australia | 99.8 /100 | #42 | Exceptional 92.9% |
| Northern Europeans | 99.8 /100 | #43 | Exceptional 92.9% |
| Dutch | 99.8 /100 | #44 | Exceptional 92.9% |
| Greeks | 99.8 /100 | #45 | Exceptional 92.9% |
Demographics Similar to Guatemalans by 12th Grade, No Diploma
In terms of 12th grade, no diploma, the demographic groups most similar to Guatemalans are Pima (84.6%, a difference of 0.040%), Salvadoran (84.5%, a difference of 0.10%), Tohono O'odham (84.7%, a difference of 0.18%), Immigrants from Yemen (84.8%, a difference of 0.32%), and Immigrants from Dominican Republic (84.9%, a difference of 0.36%).
| Demographics | Rating | Rank | 12th Grade, No Diploma |
| Central Americans | 0.0 /100 | #331 | Tragic 85.2% |
| Immigrants | Honduras | 0.0 /100 | #332 | Tragic 85.0% |
| Immigrants | Latin America | 0.0 /100 | #333 | Tragic 85.0% |
| Immigrants | Dominican Republic | 0.0 /100 | #334 | Tragic 84.9% |
| Immigrants | Yemen | 0.0 /100 | #335 | Tragic 84.8% |
| Tohono O'odham | 0.0 /100 | #336 | Tragic 84.7% |
| Pima | 0.0 /100 | #337 | Tragic 84.6% |
| Guatemalans | 0.0 /100 | #338 | Tragic 84.6% |
| Salvadorans | 0.0 /100 | #339 | Tragic 84.5% |
| Mexicans | 0.0 /100 | #340 | Tragic 84.1% |
| Immigrants | Guatemala | 0.0 /100 | #341 | Tragic 84.0% |
| Houma | 0.0 /100 | #342 | Tragic 83.7% |
| Immigrants | El Salvador | 0.0 /100 | #343 | Tragic 83.6% |
| Immigrants | Central America | 0.0 /100 | #344 | Tragic 83.0% |
| Spanish American Indians | 0.0 /100 | #345 | Tragic 82.9% |