Tlingit-Haida vs Creek 12th Grade, No Diploma

COMPARE

Tlingit-Haida
Race
Ancestry
AfghanAfricanAlaska NativeAlaskan AthabascanAlbanianAleutAlsatianAmericanApacheArabArapahoArgentineanArmenianAssyrian/Chaldean/SyriacAustralianAustrianBahamianBangladeshiBarbadianBasqueBelgianBelizeanBermudanBhutaneseBlackfeetBolivianBrazilianBritishBritish West IndianBulgarianBurmeseCajunCambodianCanadianCape VerdeanCarpatho RusynCelticCentral AmericanCentral American IndianCherokeeCheyenneChickasawChileanChineseChippewaChoctawColombianColvilleComancheCosta RicanCreeCroatianCrowCubanCypriotCzechCzechoslovakianDanishDelawareDominicanDutchDutch West IndianEastern EuropeanEcuadorianEgyptianEnglishEstonianEthiopianEuropeanFijianFilipinoFinnishFrenchFrench American IndianFrench CanadianGermanGerman RussianGhanaianGreekGuamanian/ChamorroGuatemalanGuyaneseHaitianHmongHonduranHopiHoumaHungarianIcelanderIndian (Asian)IndonesianInupiatIranianIraqiIrishIroquoisIsraeliItalianJamaicanJapaneseJordanianKenyanKiowaKoreanLaotianLatvianLebaneseLiberianLithuanianLumbeeLuxembourgerMacedonianMalaysianMalteseMarshalleseMenomineeMexicanMexican American IndianMongolianMoroccanNative HawaiianNavajoNepaleseNew ZealanderNicaraguanNigerianNorthern EuropeanNorwegianOkinawanOsageOttawaPaiutePakistaniPalestinianPanamanianParaguayanPennsylvania GermanPeruvianPimaPolishPortuguesePotawatomiPuebloPuerto RicanPuget Sound SalishRomanianRussianSalvadoranSamoanScandinavianScotch-IrishScottishSeminoleSenegaleseSerbianShoshoneSierra LeoneanSiouxSlavicSlovakSloveneSomaliSouth AfricanSouth AmericanSouth American IndianSoviet UnionSpaniardSpanishSpanish AmericanSpanish American IndianSri LankanSubsaharan AfricanSudaneseSwedishSwissSyrianTaiwaneseThaiTlingit-HaidaTohono O'OdhamTonganTrinidadian and TobagonianTsimshianTurkishU.S. Virgin IslanderUgandanUkrainianUruguayanUteVenezuelanVietnameseWelshWest IndianYakamaYaquiYugoslavianYumanYup'ikZimbabwean
Immigration
NonimmigrantsImmigrantsAfghanistanAfricaAlbaniaArgentinaArmeniaAsiaAustraliaAustriaBahamasBangladeshBarbadosBelarusBelgiumBelizeBoliviaBosnia and HerzegovinaBrazilBulgariaBurma/MyanmarCabo VerdeCambodiaCameroonCanadaCaribbeanCentral AmericaChileChinaColombiaCongoCosta RicaCroatiaCubaCzechoslovakiaDenmarkDominicaDominican RepublicEastern AfricaEastern AsiaEastern EuropeEcuadorEgyptEl SalvadorEnglandEritreaEthiopiaEuropeFijiFranceGermanyGhanaGreeceGrenadaGuatemalaGuyanaHaitiHondurasHong KongHungaryIndiaIndonesiaIranIraqIrelandIsraelItalyJamaicaJapanJordanKazakhstanKenyaKoreaKuwaitLaosLatin AmericaLatviaLebanonLiberiaLithuaniaMalaysiaMexicoMicronesiaMiddle AfricaMoldovaMoroccoNepalNetherlandsNicaraguaNigeriaNorth AmericaNorth MacedoniaNorthern AfricaNorthern EuropeNorwayOceaniaPakistanPanamaPeruPhilippinesPolandPortugalRomaniaRussiaSaudi ArabiaScotlandSenegalSerbiaSierra LeoneSingaporeSomaliaSouth AfricaSouth AmericaSouth Central AsiaSouth Eastern AsiaSouthern EuropeSpainSri LankaSt. Vincent and the GrenadinesSudanSwedenSwitzerlandSyriaTaiwanThailandTrinidad and TobagoTurkeyUgandaUkraineUruguayUzbekistanVenezuelaVietnamWest IndiesWestern AfricaWestern AsiaWestern EuropeYemenZaireZimbabweAzores
Creek
Race
Ancestry
AfghanAfricanAlaska NativeAlaskan AthabascanAlbanianAleutAlsatianAmericanApacheArabArapahoArgentineanArmenianAssyrian/Chaldean/SyriacAustralianAustrianBahamianBangladeshiBarbadianBasqueBelgianBelizeanBermudanBhutaneseBlackfeetBolivianBrazilianBritishBritish West IndianBulgarianBurmeseCajunCambodianCanadianCape VerdeanCarpatho RusynCelticCentral AmericanCentral American IndianCherokeeCheyenneChickasawChileanChineseChippewaChoctawColombianColvilleComancheCosta RicanCreeCreekCroatianCrowCubanCypriotCzechCzechoslovakianDanishDelawareDominicanDutchDutch West IndianEastern EuropeanEcuadorianEgyptianEnglishEstonianEthiopianEuropeanFijianFilipinoFinnishFrenchFrench American IndianFrench CanadianGermanGerman RussianGhanaianGreekGuamanian/ChamorroGuatemalanGuyaneseHaitianHmongHonduranHopiHoumaHungarianIcelanderIndian (Asian)IndonesianInupiatIranianIraqiIrishIroquoisIsraeliItalianJamaicanJapaneseJordanianKenyanKiowaKoreanLaotianLatvianLebaneseLiberianLithuanianLumbeeLuxembourgerMacedonianMalaysianMalteseMarshalleseMenomineeMexicanMexican American IndianMongolianMoroccanNative HawaiianNavajoNepaleseNew ZealanderNicaraguanNigerianNorthern EuropeanNorwegianOkinawanOsageOttawaPaiutePakistaniPalestinianPanamanianParaguayanPennsylvania GermanPeruvianPimaPolishPortuguesePotawatomiPuebloPuerto RicanPuget Sound SalishRomanianRussianSalvadoranSamoanScandinavianScotch-IrishScottishSeminoleSenegaleseSerbianShoshoneSierra LeoneanSiouxSlavicSlovakSloveneSomaliSouth AfricanSouth AmericanSouth American IndianSoviet UnionSpaniardSpanishSpanish AmericanSpanish American IndianSri LankanSubsaharan AfricanSudaneseSwedishSwissSyrianTaiwaneseThaiTohono O'OdhamTonganTrinidadian and TobagonianTsimshianTurkishU.S. Virgin IslanderUgandanUkrainianUruguayanUteVenezuelanVietnameseWelshWest IndianYakamaYaquiYugoslavianYumanYup'ikZimbabwean
Immigration
NonimmigrantsImmigrantsAfghanistanAfricaAlbaniaArgentinaArmeniaAsiaAustraliaAustriaBahamasBangladeshBarbadosBelarusBelgiumBelizeBoliviaBosnia and HerzegovinaBrazilBulgariaBurma/MyanmarCabo VerdeCambodiaCameroonCanadaCaribbeanCentral AmericaChileChinaColombiaCongoCosta RicaCroatiaCubaCzechoslovakiaDenmarkDominicaDominican RepublicEastern AfricaEastern AsiaEastern EuropeEcuadorEgyptEl SalvadorEnglandEritreaEthiopiaEuropeFijiFranceGermanyGhanaGreeceGrenadaGuatemalaGuyanaHaitiHondurasHong KongHungaryIndiaIndonesiaIranIraqIrelandIsraelItalyJamaicaJapanJordanKazakhstanKenyaKoreaKuwaitLaosLatin AmericaLatviaLebanonLiberiaLithuaniaMalaysiaMexicoMicronesiaMiddle AfricaMoldovaMoroccoNepalNetherlandsNicaraguaNigeriaNorth AmericaNorth MacedoniaNorthern AfricaNorthern EuropeNorwayOceaniaPakistanPanamaPeruPhilippinesPolandPortugalRomaniaRussiaSaudi ArabiaScotlandSenegalSerbiaSierra LeoneSingaporeSomaliaSouth AfricaSouth AmericaSouth Central AsiaSouth Eastern AsiaSouthern EuropeSpainSri LankaSt. Vincent and the GrenadinesSudanSwedenSwitzerlandSyriaTaiwanThailandTrinidad and TobagoTurkeyUgandaUkraineUruguayUzbekistanVenezuelaVietnamWest IndiesWestern AfricaWestern AsiaWestern EuropeYemenZaireZimbabweAzores
12th Grade, No Diploma
Income
Poverty
Unemployment
Labor Participation
Family Structure
Vehicle Availability
Education Level
Disability

12th Grade, No Diploma Comparison

Tlingit-Haida

Creek

Exceptional
Tragic
93.0%
12TH GRADE, NO DIPLOMA
99.8/ 100
METRIC RATING
38th/ 347
METRIC RANK
90.3%
12TH GRADE, NO DIPLOMA
3.9/ 100
METRIC RATING
228th/ 347
METRIC RANK

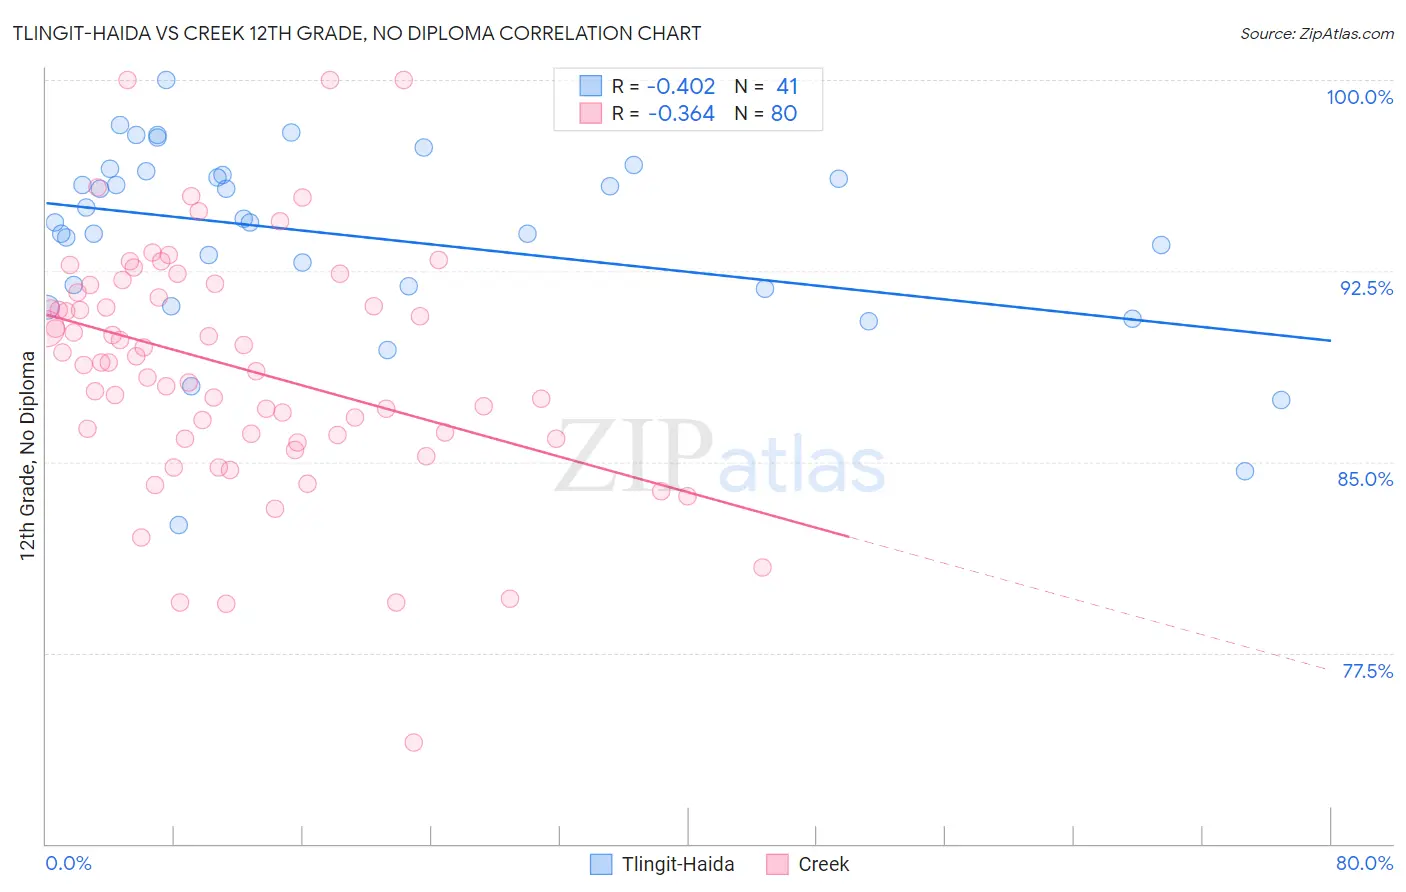
Tlingit-Haida vs Creek 12th Grade, No Diploma Correlation Chart

The statistical analysis conducted on geographies consisting of 60,871,919 people shows a moderate negative correlation between the proportion of Tlingit-Haida and percentage of population with at least 12th grade (no diploma) education in the United States with a correlation coefficient (R) of -0.402 and weighted average of 93.0%. Similarly, the statistical analysis conducted on geographies consisting of 178,480,629 people shows a mild negative correlation between the proportion of Creek and percentage of population with at least 12th grade (no diploma) education in the United States with a correlation coefficient (R) of -0.364 and weighted average of 90.3%, a difference of 3.0%.
Tlingit-Haida vs Creek 12th Grade, No Diploma

12th Grade, No Diploma Correlation Summary

MeasurementTlingit-HaidaCreek
Minimum82.5%74.0%
Maximum100.0%100.0%
Range17.5%26.0%
Mean93.9%88.7%
Median94.4%88.9%
Interquartile 25% (IQ1)91.8%86.0%
Interquartile 75% (IQ3)96.3%91.8%
Interquartile Range (IQR)4.5%5.8%
Standard Deviation (Sample)3.7%4.7%
Standard Deviation (Population)3.7%4.7%

Similar Demographics by 12th Grade, No Diploma

Demographics Similar to Tlingit-Haida by 12th Grade, No Diploma

In terms of 12th grade, no diploma, the demographic groups most similar to Tlingit-Haida are Immigrants from Austria (93.0%, a difference of 0.010%), Turkish (93.0%, a difference of 0.010%), Bhutanese (93.0%, a difference of 0.010%), Scottish (93.0%, a difference of 0.030%), and Irish (93.0%, a difference of 0.030%).
DemographicsRating | Rank12th Grade, No Diploma
Immigrants | Ireland
99.9
/100
|
#31
Exceptional
93.1%
Europeans
99.9
/100
|
#32
Exceptional
93.1%
Immigrants | Scotland
99.9
/100
|
#33
Exceptional
93.0%
Okinawans
99.9
/100
|
#34
Exceptional
93.0%
English
99.9
/100
|
#35
Exceptional
93.0%
Scottish
99.9
/100
|
#36
Exceptional
93.0%
Irish
99.9
/100
|
#37
Exceptional
93.0%
Tlingit-Haida
99.8
/100
|
#38
Exceptional
93.0%
Immigrants | Austria
99.8
/100
|
#39
Exceptional
93.0%
Turks
99.8
/100
|
#40
Exceptional
93.0%
Bhutanese
99.8
/100
|
#41
Exceptional
93.0%
Immigrants | Australia
99.8
/100
|
#42
Exceptional
92.9%
Northern Europeans
99.8
/100
|
#43
Exceptional
92.9%
Dutch
99.8
/100
|
#44
Exceptional
92.9%
Greeks
99.8
/100
|
#45
Exceptional
92.9%

Demographics Similar to Creek by 12th Grade, No Diploma

In terms of 12th grade, no diploma, the demographic groups most similar to Creek are Immigrants from Bahamas (90.2%, a difference of 0.020%), Immigrants from Zaire (90.3%, a difference of 0.050%), Nigerian (90.3%, a difference of 0.050%), Immigrants from Panama (90.3%, a difference of 0.070%), and Chickasaw (90.3%, a difference of 0.070%).
DemographicsRating | Rank12th Grade, No Diploma
Immigrants | Liberia
5.7
/100
|
#221
Tragic
90.4%
Immigrants | Somalia
5.3
/100
|
#222
Tragic
90.4%
South Americans
5.0
/100
|
#223
Tragic
90.3%
Immigrants | Panama
4.8
/100
|
#224
Tragic
90.3%
Chickasaw
4.8
/100
|
#225
Tragic
90.3%
Immigrants | Zaire
4.6
/100
|
#226
Tragic
90.3%
Nigerians
4.5
/100
|
#227
Tragic
90.3%
Creek
3.9
/100
|
#228
Tragic
90.3%
Immigrants | Bahamas
3.6
/100
|
#229
Tragic
90.2%
Immigrants | Philippines
2.8
/100
|
#230
Tragic
90.2%
Peruvians
2.7
/100
|
#231
Tragic
90.2%
Blackfeet
2.4
/100
|
#232
Tragic
90.1%
Immigrants | Thailand
2.3
/100
|
#233
Tragic
90.1%
Immigrants | South America
2.3
/100
|
#234
Tragic
90.1%
Colville
2.3
/100
|
#235
Tragic
90.1%