Tlingit-Haida vs Argentinean 12th Grade, No Diploma
COMPARE
Tlingit-Haida
Argentinean
12th Grade, No Diploma
12th Grade, No Diploma Comparison
Tlingit-Haida
Argentineans
93.0%
12TH GRADE, NO DIPLOMA
99.8/ 100
METRIC RATING
38th/ 347
METRIC RANK
91.6%
12TH GRADE, NO DIPLOMA
82.0/ 100
METRIC RATING
141st/ 347
METRIC RANK
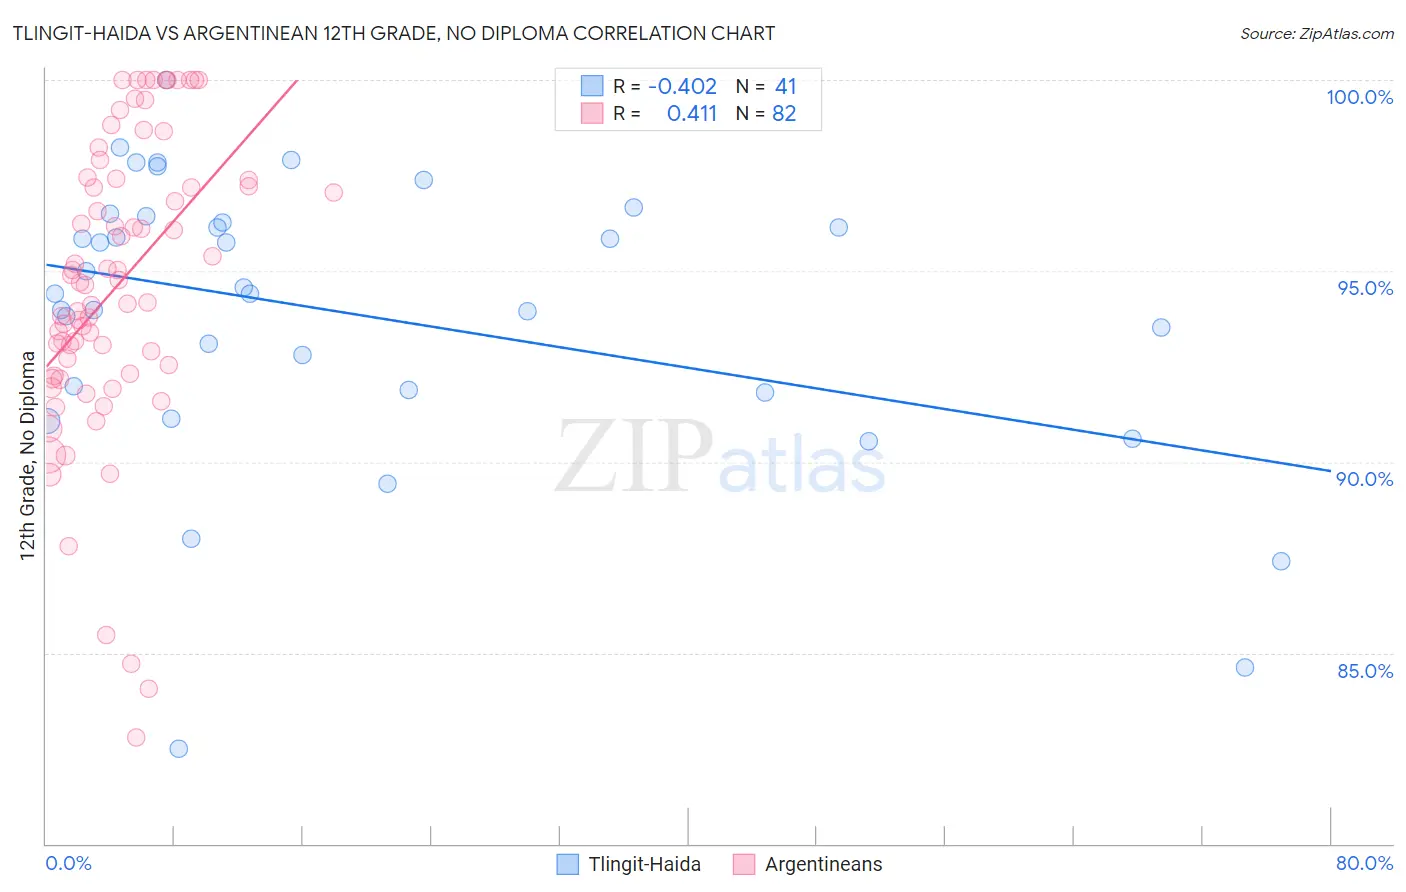
Tlingit-Haida vs Argentinean 12th Grade, No Diploma Correlation Chart
The statistical analysis conducted on geographies consisting of 60,871,919 people shows a moderate negative correlation between the proportion of Tlingit-Haida and percentage of population with at least 12th grade (no diploma) education in the United States with a correlation coefficient (R) of -0.402 and weighted average of 93.0%. Similarly, the statistical analysis conducted on geographies consisting of 297,143,432 people shows a moderate positive correlation between the proportion of Argentineans and percentage of population with at least 12th grade (no diploma) education in the United States with a correlation coefficient (R) of 0.411 and weighted average of 91.6%, a difference of 1.5%.
12th Grade, No Diploma Correlation Summary
| Measurement | Tlingit-Haida | Argentinean |
| Minimum | 82.5% | 82.8% |
| Maximum | 100.0% | 100.0% |
| Range | 17.5% | 17.2% |
| Mean | 93.9% | 94.6% |
| Median | 94.4% | 94.7% |
| Interquartile 25% (IQ1) | 91.8% | 92.3% |
| Interquartile 75% (IQ3) | 96.3% | 97.4% |
| Interquartile Range (IQR) | 4.5% | 5.1% |
| Standard Deviation (Sample) | 3.7% | 3.9% |
| Standard Deviation (Population) | 3.7% | 3.8% |
Similar Demographics by 12th Grade, No Diploma
Demographics Similar to Tlingit-Haida by 12th Grade, No Diploma
In terms of 12th grade, no diploma, the demographic groups most similar to Tlingit-Haida are Immigrants from Austria (93.0%, a difference of 0.010%), Turkish (93.0%, a difference of 0.010%), Bhutanese (93.0%, a difference of 0.010%), Scottish (93.0%, a difference of 0.030%), and Irish (93.0%, a difference of 0.030%).
| Demographics | Rating | Rank | 12th Grade, No Diploma |
| Immigrants | Ireland | 99.9 /100 | #31 | Exceptional 93.1% |
| Europeans | 99.9 /100 | #32 | Exceptional 93.1% |
| Immigrants | Scotland | 99.9 /100 | #33 | Exceptional 93.0% |
| Okinawans | 99.9 /100 | #34 | Exceptional 93.0% |
| English | 99.9 /100 | #35 | Exceptional 93.0% |
| Scottish | 99.9 /100 | #36 | Exceptional 93.0% |
| Irish | 99.9 /100 | #37 | Exceptional 93.0% |
| Tlingit-Haida | 99.8 /100 | #38 | Exceptional 93.0% |
| Immigrants | Austria | 99.8 /100 | #39 | Exceptional 93.0% |
| Turks | 99.8 /100 | #40 | Exceptional 93.0% |
| Bhutanese | 99.8 /100 | #41 | Exceptional 93.0% |
| Immigrants | Australia | 99.8 /100 | #42 | Exceptional 92.9% |
| Northern Europeans | 99.8 /100 | #43 | Exceptional 92.9% |
| Dutch | 99.8 /100 | #44 | Exceptional 92.9% |
| Greeks | 99.8 /100 | #45 | Exceptional 92.9% |
Demographics Similar to Argentineans by 12th Grade, No Diploma
In terms of 12th grade, no diploma, the demographic groups most similar to Argentineans are Immigrants from Poland (91.6%, a difference of 0.010%), Immigrants from Venezuela (91.6%, a difference of 0.020%), Immigrants from Argentina (91.6%, a difference of 0.030%), Immigrants from Egypt (91.6%, a difference of 0.040%), and Immigrants from Spain (91.6%, a difference of 0.040%).
| Demographics | Rating | Rank | 12th Grade, No Diploma |
| Venezuelans | 88.2 /100 | #134 | Excellent 91.7% |
| Immigrants | Bosnia and Herzegovina | 87.3 /100 | #135 | Excellent 91.7% |
| Chileans | 85.8 /100 | #136 | Excellent 91.7% |
| Alaska Natives | 84.9 /100 | #137 | Excellent 91.6% |
| Arabs | 84.1 /100 | #138 | Excellent 91.6% |
| Immigrants | Egypt | 83.9 /100 | #139 | Excellent 91.6% |
| Immigrants | Poland | 82.3 /100 | #140 | Excellent 91.6% |
| Argentineans | 82.0 /100 | #141 | Excellent 91.6% |
| Immigrants | Venezuela | 80.9 /100 | #142 | Excellent 91.6% |
| Immigrants | Argentina | 80.7 /100 | #143 | Excellent 91.6% |
| Immigrants | Spain | 80.1 /100 | #144 | Excellent 91.6% |
| Immigrants | Lebanon | 80.0 /100 | #145 | Excellent 91.6% |
| Immigrants | Brazil | 79.8 /100 | #146 | Good 91.5% |
| Pakistanis | 79.6 /100 | #147 | Good 91.5% |
| Indians (Asian) | 79.4 /100 | #148 | Good 91.5% |