Black/African American vs Marshallese 12th Grade, No Diploma
COMPARE
Black/African American
Marshallese
12th Grade, No Diploma
12th Grade, No Diploma Comparison
Blacks/African Americans
Marshallese
89.3%
12TH GRADE, NO DIPLOMA
0.1/ 100
METRIC RATING
271st/ 347
METRIC RANK
90.7%
12TH GRADE, NO DIPLOMA
18.2/ 100
METRIC RATING
202nd/ 347
METRIC RANK
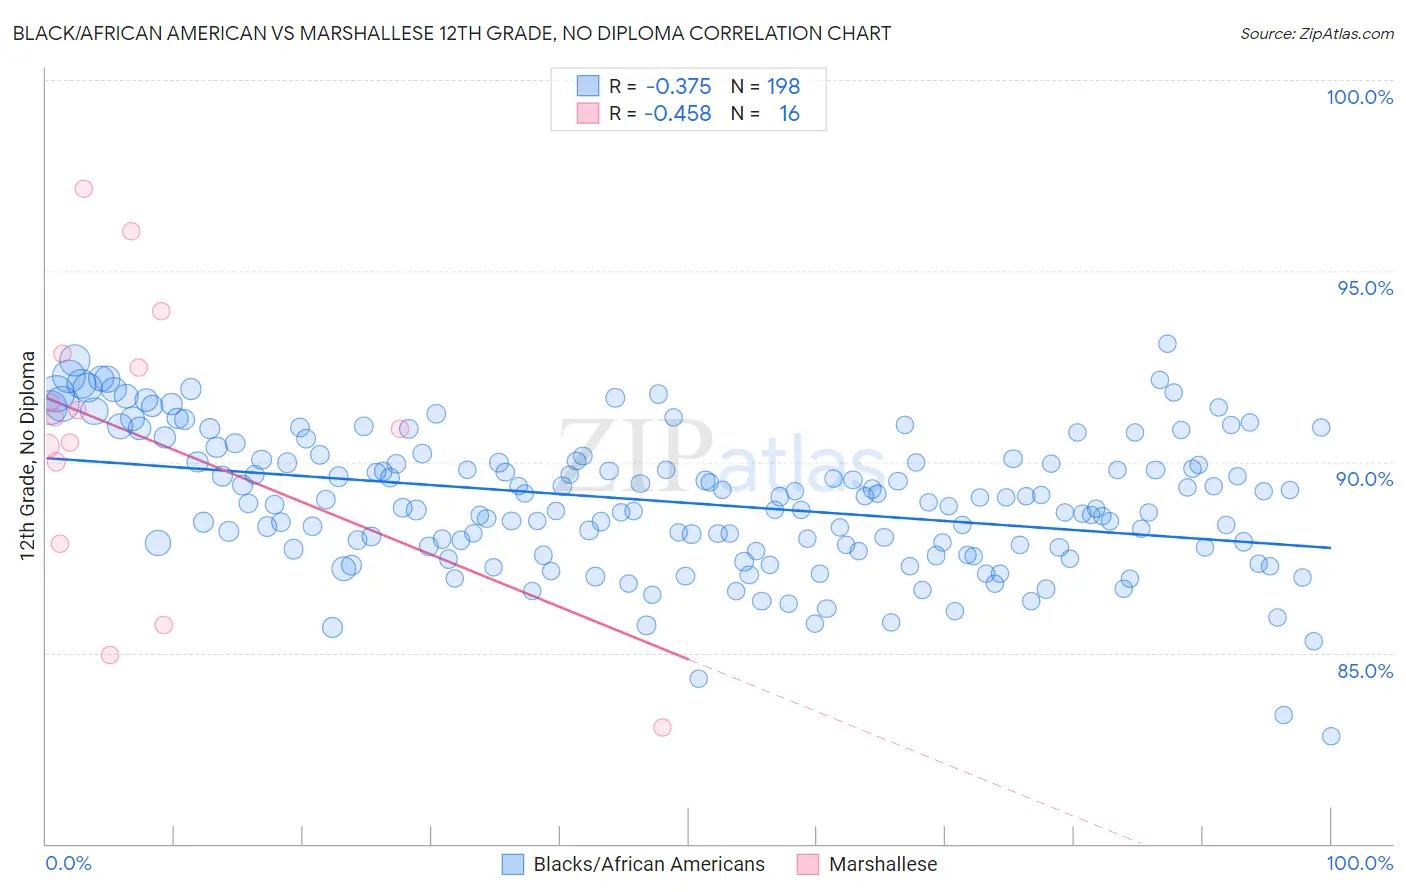
Black/African American vs Marshallese 12th Grade, No Diploma Correlation Chart
The statistical analysis conducted on geographies consisting of 566,032,166 people shows a mild negative correlation between the proportion of Blacks/African Americans and percentage of population with at least 12th grade (no diploma) education in the United States with a correlation coefficient (R) of -0.375 and weighted average of 89.3%. Similarly, the statistical analysis conducted on geographies consisting of 14,761,315 people shows a moderate negative correlation between the proportion of Marshallese and percentage of population with at least 12th grade (no diploma) education in the United States with a correlation coefficient (R) of -0.458 and weighted average of 90.7%, a difference of 1.7%.
12th Grade, No Diploma Correlation Summary
| Measurement | Black/African American | Marshallese |
| Minimum | 82.8% | 83.0% |
| Maximum | 93.1% | 97.2% |
| Range | 10.3% | 14.1% |
| Mean | 88.9% | 90.6% |
| Median | 88.9% | 91.0% |
| Interquartile 25% (IQ1) | 87.7% | 88.9% |
| Interquartile 75% (IQ3) | 90.0% | 92.6% |
| Interquartile Range (IQR) | 2.3% | 3.7% |
| Standard Deviation (Sample) | 1.8% | 3.8% |
| Standard Deviation (Population) | 1.8% | 3.7% |
Similar Demographics by 12th Grade, No Diploma
Demographics Similar to Blacks/African Americans by 12th Grade, No Diploma
In terms of 12th grade, no diploma, the demographic groups most similar to Blacks/African Americans are Bangladeshi (89.3%, a difference of 0.0%), Malaysian (89.2%, a difference of 0.010%), U.S. Virgin Islander (89.3%, a difference of 0.050%), Immigrants from Trinidad and Tobago (89.3%, a difference of 0.080%), and West Indian (89.3%, a difference of 0.10%).
| Demographics | Rating | Rank | 12th Grade, No Diploma |
| Sri Lankans | 0.2 /100 | #264 | Tragic 89.4% |
| Trinidadians and Tobagonians | 0.2 /100 | #265 | Tragic 89.4% |
| Seminole | 0.2 /100 | #266 | Tragic 89.4% |
| West Indians | 0.2 /100 | #267 | Tragic 89.3% |
| Immigrants | Trinidad and Tobago | 0.1 /100 | #268 | Tragic 89.3% |
| U.S. Virgin Islanders | 0.1 /100 | #269 | Tragic 89.3% |
| Bangladeshis | 0.1 /100 | #270 | Tragic 89.3% |
| Blacks/African Americans | 0.1 /100 | #271 | Tragic 89.3% |
| Malaysians | 0.1 /100 | #272 | Tragic 89.2% |
| Barbadians | 0.1 /100 | #273 | Tragic 89.1% |
| Cajuns | 0.1 /100 | #274 | Tragic 89.1% |
| Immigrants | Congo | 0.1 /100 | #275 | Tragic 89.0% |
| Ute | 0.1 /100 | #276 | Tragic 89.0% |
| Immigrants | Barbados | 0.0 /100 | #277 | Tragic 89.0% |
| Immigrants | St. Vincent and the Grenadines | 0.0 /100 | #278 | Tragic 88.9% |
Demographics Similar to Marshallese by 12th Grade, No Diploma
In terms of 12th grade, no diploma, the demographic groups most similar to Marshallese are Immigrants from Southern Europe (90.8%, a difference of 0.030%), Liberian (90.8%, a difference of 0.030%), Hawaiian (90.8%, a difference of 0.030%), Samoan (90.8%, a difference of 0.040%), and Tongan (90.7%, a difference of 0.050%).
| Demographics | Rating | Rank | 12th Grade, No Diploma |
| Koreans | 24.5 /100 | #195 | Fair 90.8% |
| Panamanians | 22.8 /100 | #196 | Fair 90.8% |
| Immigrants | Sudan | 22.6 /100 | #197 | Fair 90.8% |
| Samoans | 20.4 /100 | #198 | Fair 90.8% |
| Immigrants | Southern Europe | 19.9 /100 | #199 | Poor 90.8% |
| Liberians | 19.8 /100 | #200 | Poor 90.8% |
| Hawaiians | 19.7 /100 | #201 | Poor 90.8% |
| Marshallese | 18.2 /100 | #202 | Poor 90.7% |
| Tongans | 16.1 /100 | #203 | Poor 90.7% |
| French American Indians | 15.5 /100 | #204 | Poor 90.7% |
| Immigrants | Sierra Leone | 14.9 /100 | #205 | Poor 90.7% |
| Immigrants | Bolivia | 12.3 /100 | #206 | Poor 90.6% |
| Armenians | 11.6 /100 | #207 | Poor 90.6% |
| Immigrants | Micronesia | 11.0 /100 | #208 | Poor 90.6% |
| Immigrants | Afghanistan | 11.0 /100 | #209 | Poor 90.6% |