Immigrants from Asia vs Marshallese 12th Grade, No Diploma
COMPARE
Immigrants from Asia
Marshallese
12th Grade, No Diploma
12th Grade, No Diploma Comparison
Immigrants from Asia
Marshallese
91.3%
12TH GRADE, NO DIPLOMA
61.5/ 100
METRIC RATING
163rd/ 347
METRIC RANK
90.7%
12TH GRADE, NO DIPLOMA
18.2/ 100
METRIC RATING
202nd/ 347
METRIC RANK
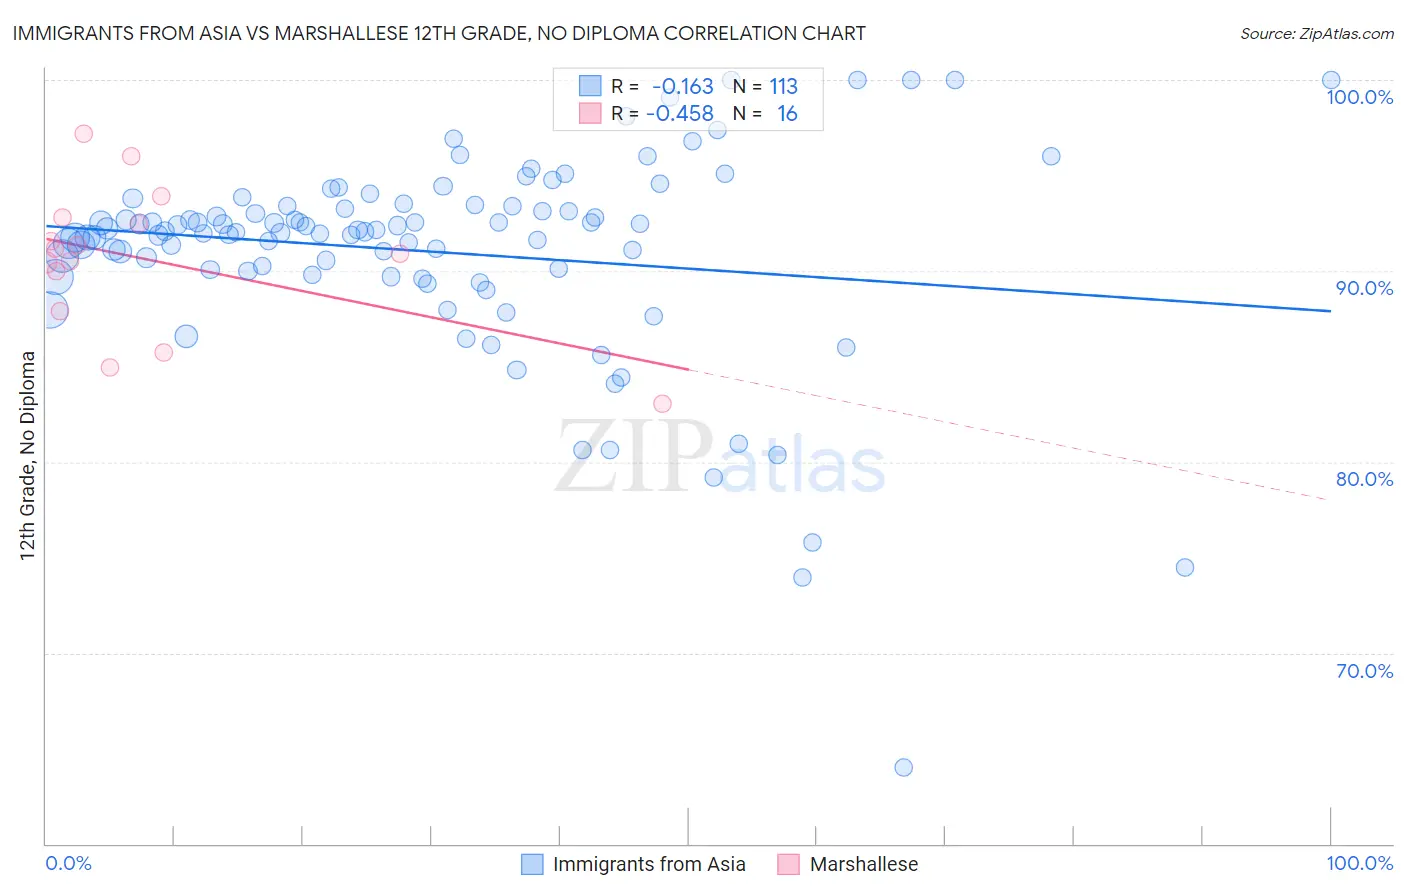
Immigrants from Asia vs Marshallese 12th Grade, No Diploma Correlation Chart
The statistical analysis conducted on geographies consisting of 549,170,397 people shows a poor negative correlation between the proportion of Immigrants from Asia and percentage of population with at least 12th grade (no diploma) education in the United States with a correlation coefficient (R) of -0.163 and weighted average of 91.3%. Similarly, the statistical analysis conducted on geographies consisting of 14,761,315 people shows a moderate negative correlation between the proportion of Marshallese and percentage of population with at least 12th grade (no diploma) education in the United States with a correlation coefficient (R) of -0.458 and weighted average of 90.7%, a difference of 0.61%.
12th Grade, No Diploma Correlation Summary
| Measurement | Immigrants from Asia | Marshallese |
| Minimum | 64.0% | 83.0% |
| Maximum | 100.0% | 97.2% |
| Range | 36.0% | 14.1% |
| Mean | 91.0% | 90.6% |
| Median | 92.1% | 91.0% |
| Interquartile 25% (IQ1) | 89.9% | 88.9% |
| Interquartile 75% (IQ3) | 93.4% | 92.6% |
| Interquartile Range (IQR) | 3.5% | 3.7% |
| Standard Deviation (Sample) | 5.5% | 3.8% |
| Standard Deviation (Population) | 5.5% | 3.7% |
Similar Demographics by 12th Grade, No Diploma
Demographics Similar to Immigrants from Asia by 12th Grade, No Diploma
In terms of 12th grade, no diploma, the demographic groups most similar to Immigrants from Asia are Brazilian (91.3%, a difference of 0.010%), Immigrants from China (91.3%, a difference of 0.010%), Immigrants from Albania (91.3%, a difference of 0.030%), Immigrants from Hong Kong (91.3%, a difference of 0.030%), and Laotian (91.3%, a difference of 0.040%).
| Demographics | Rating | Rank | 12th Grade, No Diploma |
| Asians | 71.9 /100 | #156 | Good 91.4% |
| Immigrants | Pakistan | 70.7 /100 | #157 | Good 91.4% |
| Immigrants | Northern Africa | 66.2 /100 | #158 | Good 91.4% |
| Laotians | 64.4 /100 | #159 | Good 91.3% |
| Immigrants | Albania | 64.1 /100 | #160 | Good 91.3% |
| Immigrants | Hong Kong | 63.8 /100 | #161 | Good 91.3% |
| Brazilians | 62.0 /100 | #162 | Good 91.3% |
| Immigrants | Asia | 61.5 /100 | #163 | Good 91.3% |
| Immigrants | China | 60.9 /100 | #164 | Good 91.3% |
| Alsatians | 58.3 /100 | #165 | Average 91.3% |
| Hmong | 58.0 /100 | #166 | Average 91.3% |
| Immigrants | Malaysia | 57.8 /100 | #167 | Average 91.3% |
| Cree | 57.0 /100 | #168 | Average 91.2% |
| Immigrants | Indonesia | 54.9 /100 | #169 | Average 91.2% |
| Delaware | 52.8 /100 | #170 | Average 91.2% |
Demographics Similar to Marshallese by 12th Grade, No Diploma
In terms of 12th grade, no diploma, the demographic groups most similar to Marshallese are Immigrants from Southern Europe (90.8%, a difference of 0.030%), Liberian (90.8%, a difference of 0.030%), Hawaiian (90.8%, a difference of 0.030%), Samoan (90.8%, a difference of 0.040%), and Tongan (90.7%, a difference of 0.050%).
| Demographics | Rating | Rank | 12th Grade, No Diploma |
| Koreans | 24.5 /100 | #195 | Fair 90.8% |
| Panamanians | 22.8 /100 | #196 | Fair 90.8% |
| Immigrants | Sudan | 22.6 /100 | #197 | Fair 90.8% |
| Samoans | 20.4 /100 | #198 | Fair 90.8% |
| Immigrants | Southern Europe | 19.9 /100 | #199 | Poor 90.8% |
| Liberians | 19.8 /100 | #200 | Poor 90.8% |
| Hawaiians | 19.7 /100 | #201 | Poor 90.8% |
| Marshallese | 18.2 /100 | #202 | Poor 90.7% |
| Tongans | 16.1 /100 | #203 | Poor 90.7% |
| French American Indians | 15.5 /100 | #204 | Poor 90.7% |
| Immigrants | Sierra Leone | 14.9 /100 | #205 | Poor 90.7% |
| Immigrants | Bolivia | 12.3 /100 | #206 | Poor 90.6% |
| Armenians | 11.6 /100 | #207 | Poor 90.6% |
| Immigrants | Micronesia | 11.0 /100 | #208 | Poor 90.6% |
| Immigrants | Afghanistan | 11.0 /100 | #209 | Poor 90.6% |