White/Caucasian vs Marshallese 12th Grade, No Diploma
COMPARE
White/Caucasian
Marshallese
12th Grade, No Diploma
12th Grade, No Diploma Comparison
Whites/Caucasians
Marshallese
91.8%
12TH GRADE, NO DIPLOMA
91.6/ 100
METRIC RATING
125th/ 347
METRIC RANK
90.7%
12TH GRADE, NO DIPLOMA
18.2/ 100
METRIC RATING
202nd/ 347
METRIC RANK
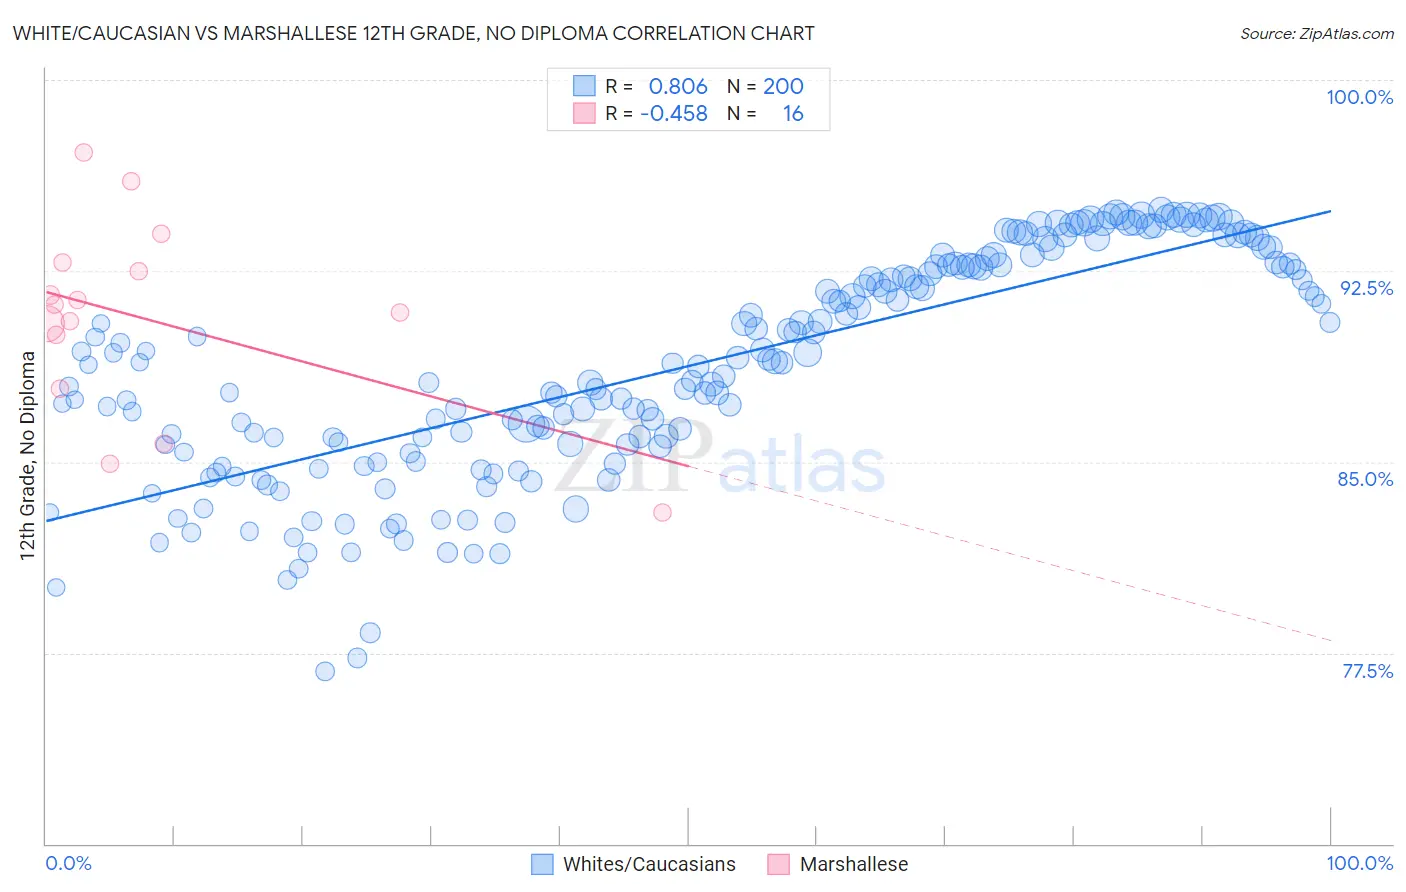
White/Caucasian vs Marshallese 12th Grade, No Diploma Correlation Chart
The statistical analysis conducted on geographies consisting of 585,243,214 people shows a very strong positive correlation between the proportion of Whites/Caucasians and percentage of population with at least 12th grade (no diploma) education in the United States with a correlation coefficient (R) of 0.806 and weighted average of 91.8%. Similarly, the statistical analysis conducted on geographies consisting of 14,761,315 people shows a moderate negative correlation between the proportion of Marshallese and percentage of population with at least 12th grade (no diploma) education in the United States with a correlation coefficient (R) of -0.458 and weighted average of 90.7%, a difference of 1.2%.
12th Grade, No Diploma Correlation Summary
| Measurement | White/Caucasian | Marshallese |
| Minimum | 76.8% | 83.0% |
| Maximum | 94.9% | 97.2% |
| Range | 18.1% | 14.1% |
| Mean | 88.8% | 90.6% |
| Median | 88.9% | 91.0% |
| Interquartile 25% (IQ1) | 85.6% | 88.9% |
| Interquartile 75% (IQ3) | 92.7% | 92.6% |
| Interquartile Range (IQR) | 7.1% | 3.7% |
| Standard Deviation (Sample) | 4.4% | 3.8% |
| Standard Deviation (Population) | 4.4% | 3.7% |
Similar Demographics by 12th Grade, No Diploma
Demographics Similar to Whites/Caucasians by 12th Grade, No Diploma
In terms of 12th grade, no diploma, the demographic groups most similar to Whites/Caucasians are Immigrants from Ukraine (91.8%, a difference of 0.0%), Basque (91.8%, a difference of 0.010%), Immigrants from Jordan (91.8%, a difference of 0.020%), Egyptian (91.9%, a difference of 0.040%), and Mongolian (91.8%, a difference of 0.060%).
| Demographics | Rating | Rank | 12th Grade, No Diploma |
| Puget Sound Salish | 95.8 /100 | #118 | Exceptional 92.0% |
| Immigrants | Germany | 95.5 /100 | #119 | Exceptional 92.0% |
| Immigrants | Kazakhstan | 94.2 /100 | #120 | Exceptional 91.9% |
| Menominee | 93.5 /100 | #121 | Exceptional 91.9% |
| Ottawa | 93.1 /100 | #122 | Exceptional 91.9% |
| Egyptians | 92.5 /100 | #123 | Exceptional 91.9% |
| Immigrants | Ukraine | 91.6 /100 | #124 | Exceptional 91.8% |
| Whites/Caucasians | 91.6 /100 | #125 | Exceptional 91.8% |
| Basques | 91.3 /100 | #126 | Exceptional 91.8% |
| Immigrants | Jordan | 91.0 /100 | #127 | Exceptional 91.8% |
| Mongolians | 89.9 /100 | #128 | Excellent 91.8% |
| German Russians | 89.8 /100 | #129 | Excellent 91.8% |
| Assyrians/Chaldeans/Syriacs | 89.6 /100 | #130 | Excellent 91.8% |
| Albanians | 89.3 /100 | #131 | Excellent 91.8% |
| Immigrants | Eastern Asia | 89.3 /100 | #132 | Excellent 91.8% |
Demographics Similar to Marshallese by 12th Grade, No Diploma
In terms of 12th grade, no diploma, the demographic groups most similar to Marshallese are Immigrants from Southern Europe (90.8%, a difference of 0.030%), Liberian (90.8%, a difference of 0.030%), Hawaiian (90.8%, a difference of 0.030%), Samoan (90.8%, a difference of 0.040%), and Tongan (90.7%, a difference of 0.050%).
| Demographics | Rating | Rank | 12th Grade, No Diploma |
| Koreans | 24.5 /100 | #195 | Fair 90.8% |
| Panamanians | 22.8 /100 | #196 | Fair 90.8% |
| Immigrants | Sudan | 22.6 /100 | #197 | Fair 90.8% |
| Samoans | 20.4 /100 | #198 | Fair 90.8% |
| Immigrants | Southern Europe | 19.9 /100 | #199 | Poor 90.8% |
| Liberians | 19.8 /100 | #200 | Poor 90.8% |
| Hawaiians | 19.7 /100 | #201 | Poor 90.8% |
| Marshallese | 18.2 /100 | #202 | Poor 90.7% |
| Tongans | 16.1 /100 | #203 | Poor 90.7% |
| French American Indians | 15.5 /100 | #204 | Poor 90.7% |
| Immigrants | Sierra Leone | 14.9 /100 | #205 | Poor 90.7% |
| Immigrants | Bolivia | 12.3 /100 | #206 | Poor 90.6% |
| Armenians | 11.6 /100 | #207 | Poor 90.6% |
| Immigrants | Micronesia | 11.0 /100 | #208 | Poor 90.6% |
| Immigrants | Afghanistan | 11.0 /100 | #209 | Poor 90.6% |