Shoshone vs Luxembourger College, 1 year or more
COMPARE
Shoshone
Luxembourger
College, 1 year or more
College, 1 year or more Comparison
Shoshone
Luxembourgers
54.3%
COLLEGE, 1 YEAR OR MORE
0.2/ 100
METRIC RATING
276th/ 347
METRIC RANK
62.1%
COLLEGE, 1 YEAR OR MORE
96.7/ 100
METRIC RATING
102nd/ 347
METRIC RANK
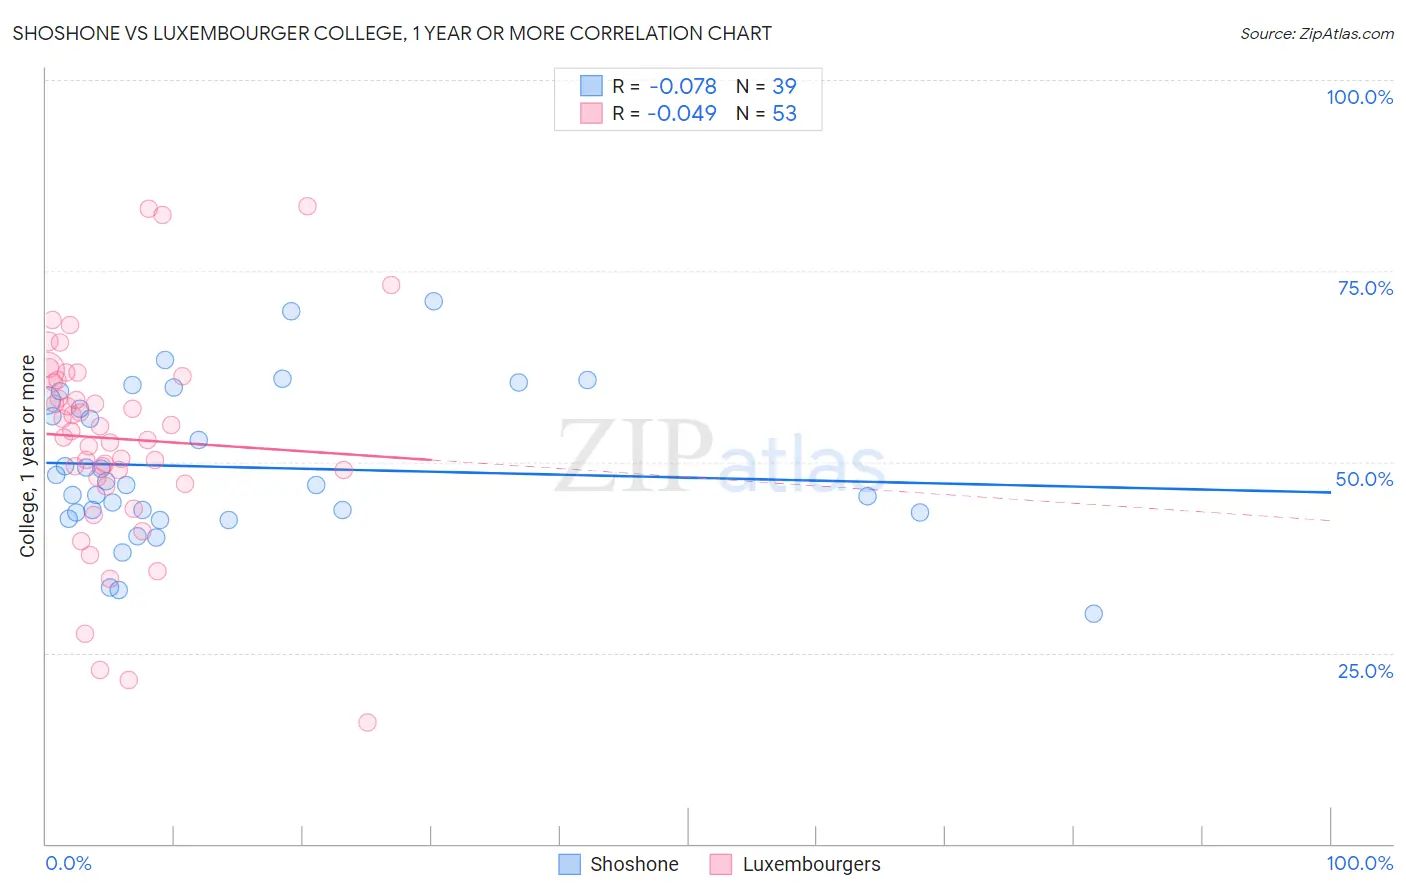
Shoshone vs Luxembourger College, 1 year or more Correlation Chart
The statistical analysis conducted on geographies consisting of 66,627,303 people shows a slight negative correlation between the proportion of Shoshone and percentage of population with at least college, 1 year or more education in the United States with a correlation coefficient (R) of -0.078 and weighted average of 54.3%. Similarly, the statistical analysis conducted on geographies consisting of 144,676,190 people shows no correlation between the proportion of Luxembourgers and percentage of population with at least college, 1 year or more education in the United States with a correlation coefficient (R) of -0.049 and weighted average of 62.1%, a difference of 14.2%.
College, 1 year or more Correlation Summary
| Measurement | Shoshone | Luxembourger |
| Minimum | 30.1% | 15.8% |
| Maximum | 71.1% | 83.5% |
| Range | 41.0% | 67.6% |
| Mean | 49.3% | 53.0% |
| Median | 47.0% | 54.1% |
| Interquartile 25% (IQ1) | 43.3% | 47.5% |
| Interquartile 75% (IQ3) | 58.0% | 61.0% |
| Interquartile Range (IQR) | 14.7% | 13.4% |
| Standard Deviation (Sample) | 9.7% | 13.9% |
| Standard Deviation (Population) | 9.6% | 13.8% |
Similar Demographics by College, 1 year or more
Demographics Similar to Shoshone by College, 1 year or more
In terms of college, 1 year or more, the demographic groups most similar to Shoshone are Ecuadorian (54.3%, a difference of 0.040%), American (54.4%, a difference of 0.080%), Belizean (54.4%, a difference of 0.11%), Immigrants from Grenada (54.4%, a difference of 0.15%), and Comanche (54.4%, a difference of 0.18%).
| Demographics | Rating | Rank | College, 1 year or more |
| Bangladeshis | 0.2 /100 | #269 | Tragic 54.5% |
| Crow | 0.2 /100 | #270 | Tragic 54.5% |
| Bahamians | 0.2 /100 | #271 | Tragic 54.5% |
| Comanche | 0.2 /100 | #272 | Tragic 54.4% |
| Immigrants | Grenada | 0.2 /100 | #273 | Tragic 54.4% |
| Belizeans | 0.2 /100 | #274 | Tragic 54.4% |
| Americans | 0.2 /100 | #275 | Tragic 54.4% |
| Shoshone | 0.2 /100 | #276 | Tragic 54.3% |
| Ecuadorians | 0.2 /100 | #277 | Tragic 54.3% |
| Immigrants | Jamaica | 0.1 /100 | #278 | Tragic 54.2% |
| Arapaho | 0.1 /100 | #279 | Tragic 54.1% |
| Cheyenne | 0.1 /100 | #280 | Tragic 54.1% |
| Colville | 0.1 /100 | #281 | Tragic 54.1% |
| Guyanese | 0.1 /100 | #282 | Tragic 54.1% |
| Nicaraguans | 0.1 /100 | #283 | Tragic 53.9% |
Demographics Similar to Luxembourgers by College, 1 year or more
In terms of college, 1 year or more, the demographic groups most similar to Luxembourgers are Icelander (62.1%, a difference of 0.020%), Swedish (62.1%, a difference of 0.020%), Afghan (62.0%, a difference of 0.12%), Chilean (62.0%, a difference of 0.13%), and Immigrants from Nepal (62.0%, a difference of 0.15%).
| Demographics | Rating | Rank | College, 1 year or more |
| British | 97.4 /100 | #95 | Exceptional 62.3% |
| Chinese | 97.2 /100 | #96 | Exceptional 62.2% |
| Jordanians | 97.2 /100 | #97 | Exceptional 62.2% |
| Carpatho Rusyns | 97.2 /100 | #98 | Exceptional 62.2% |
| Croatians | 97.1 /100 | #99 | Exceptional 62.2% |
| Icelanders | 96.8 /100 | #100 | Exceptional 62.1% |
| Swedes | 96.8 /100 | #101 | Exceptional 62.1% |
| Luxembourgers | 96.7 /100 | #102 | Exceptional 62.1% |
| Afghans | 96.4 /100 | #103 | Exceptional 62.0% |
| Chileans | 96.4 /100 | #104 | Exceptional 62.0% |
| Immigrants | Nepal | 96.3 /100 | #105 | Exceptional 62.0% |
| Palestinians | 96.3 /100 | #106 | Exceptional 62.0% |
| Immigrants | Ukraine | 95.8 /100 | #107 | Exceptional 61.9% |
| Syrians | 95.7 /100 | #108 | Exceptional 61.9% |
| Immigrants | Northern Africa | 95.7 /100 | #109 | Exceptional 61.9% |