Immigrants from Philippines vs Luxembourger College, 1 year or more
COMPARE
Immigrants from Philippines
Luxembourger
College, 1 year or more
College, 1 year or more Comparison
Immigrants from Philippines
Luxembourgers
58.7%
COLLEGE, 1 YEAR OR MORE
29.2/ 100
METRIC RATING
191st/ 347
METRIC RANK
62.1%
COLLEGE, 1 YEAR OR MORE
96.7/ 100
METRIC RATING
102nd/ 347
METRIC RANK
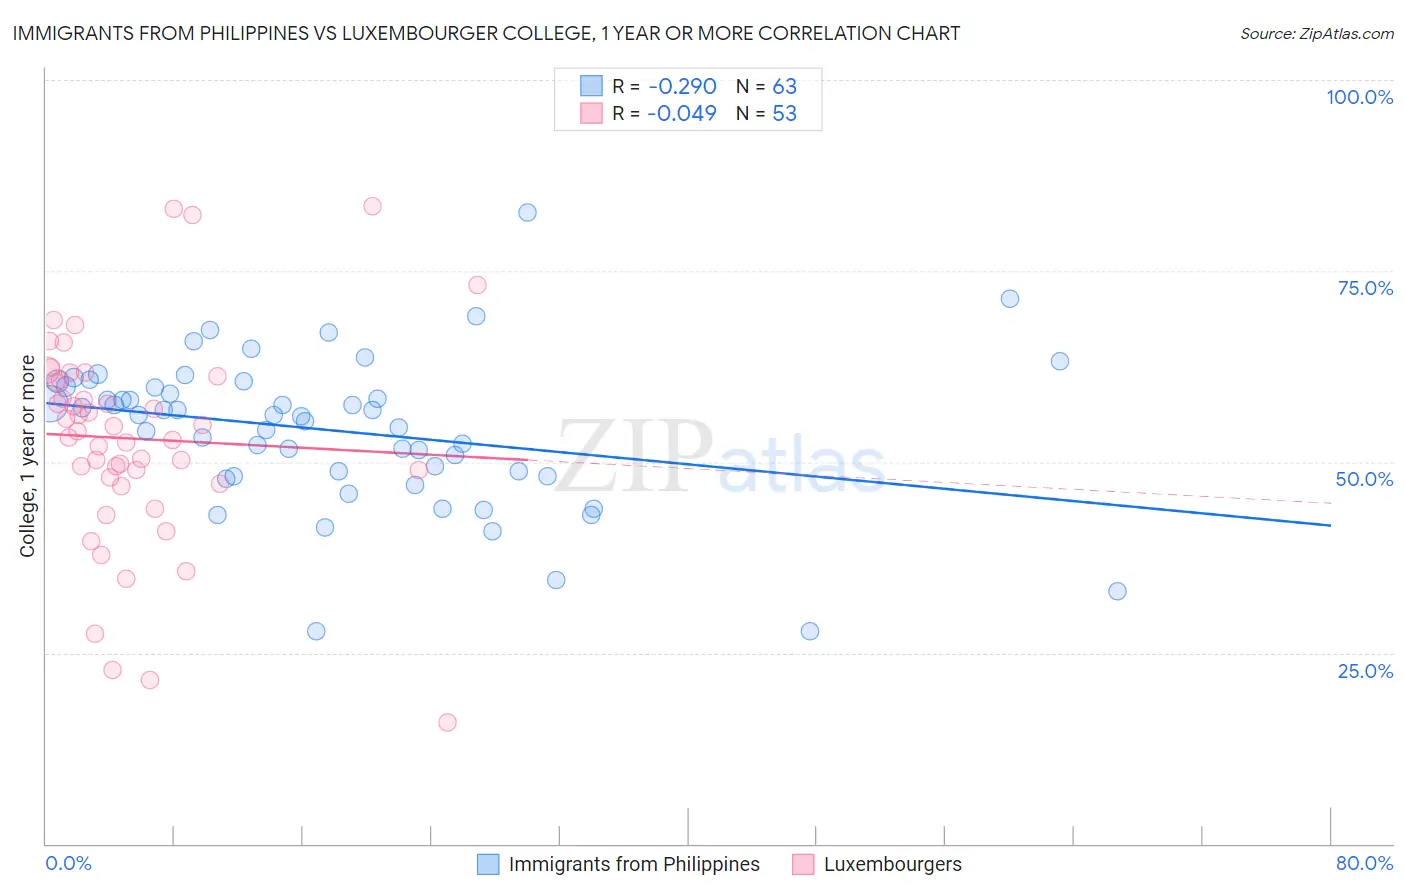
Immigrants from Philippines vs Luxembourger College, 1 year or more Correlation Chart
The statistical analysis conducted on geographies consisting of 471,303,821 people shows a weak negative correlation between the proportion of Immigrants from Philippines and percentage of population with at least college, 1 year or more education in the United States with a correlation coefficient (R) of -0.290 and weighted average of 58.7%. Similarly, the statistical analysis conducted on geographies consisting of 144,676,190 people shows no correlation between the proportion of Luxembourgers and percentage of population with at least college, 1 year or more education in the United States with a correlation coefficient (R) of -0.049 and weighted average of 62.1%, a difference of 5.7%.
College, 1 year or more Correlation Summary
| Measurement | Immigrants from Philippines | Luxembourger |
| Minimum | 27.9% | 15.8% |
| Maximum | 82.6% | 83.5% |
| Range | 54.7% | 67.6% |
| Mean | 54.1% | 53.0% |
| Median | 56.1% | 54.1% |
| Interquartile 25% (IQ1) | 48.1% | 47.5% |
| Interquartile 75% (IQ3) | 59.9% | 61.0% |
| Interquartile Range (IQR) | 11.7% | 13.4% |
| Standard Deviation (Sample) | 9.9% | 13.9% |
| Standard Deviation (Population) | 9.8% | 13.8% |
Similar Demographics by College, 1 year or more
Demographics Similar to Immigrants from Philippines by College, 1 year or more
In terms of college, 1 year or more, the demographic groups most similar to Immigrants from Philippines are Colombian (58.7%, a difference of 0.10%), Peruvian (58.6%, a difference of 0.11%), Immigrants from Cameroon (58.8%, a difference of 0.13%), Uruguayan (58.8%, a difference of 0.17%), and Costa Rican (58.6%, a difference of 0.18%).
| Demographics | Rating | Rank | College, 1 year or more |
| Spaniards | 38.3 /100 | #184 | Fair 59.0% |
| South Americans | 35.9 /100 | #185 | Fair 59.0% |
| Scotch-Irish | 34.7 /100 | #186 | Fair 58.9% |
| Germans | 34.7 /100 | #187 | Fair 58.9% |
| French | 34.4 /100 | #188 | Fair 58.9% |
| Uruguayans | 31.8 /100 | #189 | Fair 58.8% |
| Immigrants | Cameroon | 31.2 /100 | #190 | Fair 58.8% |
| Immigrants | Philippines | 29.2 /100 | #191 | Fair 58.7% |
| Colombians | 27.6 /100 | #192 | Fair 58.7% |
| Peruvians | 27.5 /100 | #193 | Fair 58.6% |
| Costa Ricans | 26.4 /100 | #194 | Fair 58.6% |
| Dutch | 26.2 /100 | #195 | Fair 58.6% |
| Guamanians/Chamorros | 26.2 /100 | #196 | Fair 58.6% |
| Immigrants | Thailand | 26.0 /100 | #197 | Fair 58.6% |
| Immigrants | South Eastern Asia | 25.1 /100 | #198 | Fair 58.5% |
Demographics Similar to Luxembourgers by College, 1 year or more
In terms of college, 1 year or more, the demographic groups most similar to Luxembourgers are Icelander (62.1%, a difference of 0.020%), Swedish (62.1%, a difference of 0.020%), Afghan (62.0%, a difference of 0.12%), Chilean (62.0%, a difference of 0.13%), and Immigrants from Nepal (62.0%, a difference of 0.15%).
| Demographics | Rating | Rank | College, 1 year or more |
| British | 97.4 /100 | #95 | Exceptional 62.3% |
| Chinese | 97.2 /100 | #96 | Exceptional 62.2% |
| Jordanians | 97.2 /100 | #97 | Exceptional 62.2% |
| Carpatho Rusyns | 97.2 /100 | #98 | Exceptional 62.2% |
| Croatians | 97.1 /100 | #99 | Exceptional 62.2% |
| Icelanders | 96.8 /100 | #100 | Exceptional 62.1% |
| Swedes | 96.8 /100 | #101 | Exceptional 62.1% |
| Luxembourgers | 96.7 /100 | #102 | Exceptional 62.1% |
| Afghans | 96.4 /100 | #103 | Exceptional 62.0% |
| Chileans | 96.4 /100 | #104 | Exceptional 62.0% |
| Immigrants | Nepal | 96.3 /100 | #105 | Exceptional 62.0% |
| Palestinians | 96.3 /100 | #106 | Exceptional 62.0% |
| Immigrants | Ukraine | 95.8 /100 | #107 | Exceptional 61.9% |
| Syrians | 95.7 /100 | #108 | Exceptional 61.9% |
| Immigrants | Northern Africa | 95.7 /100 | #109 | Exceptional 61.9% |