Japanese vs Luxembourger College, 1 year or more
COMPARE
Japanese
Luxembourger
College, 1 year or more
College, 1 year or more Comparison
Japanese
Luxembourgers
55.2%
COLLEGE, 1 YEAR OR MORE
0.5/ 100
METRIC RATING
254th/ 347
METRIC RANK
62.1%
COLLEGE, 1 YEAR OR MORE
96.7/ 100
METRIC RATING
102nd/ 347
METRIC RANK
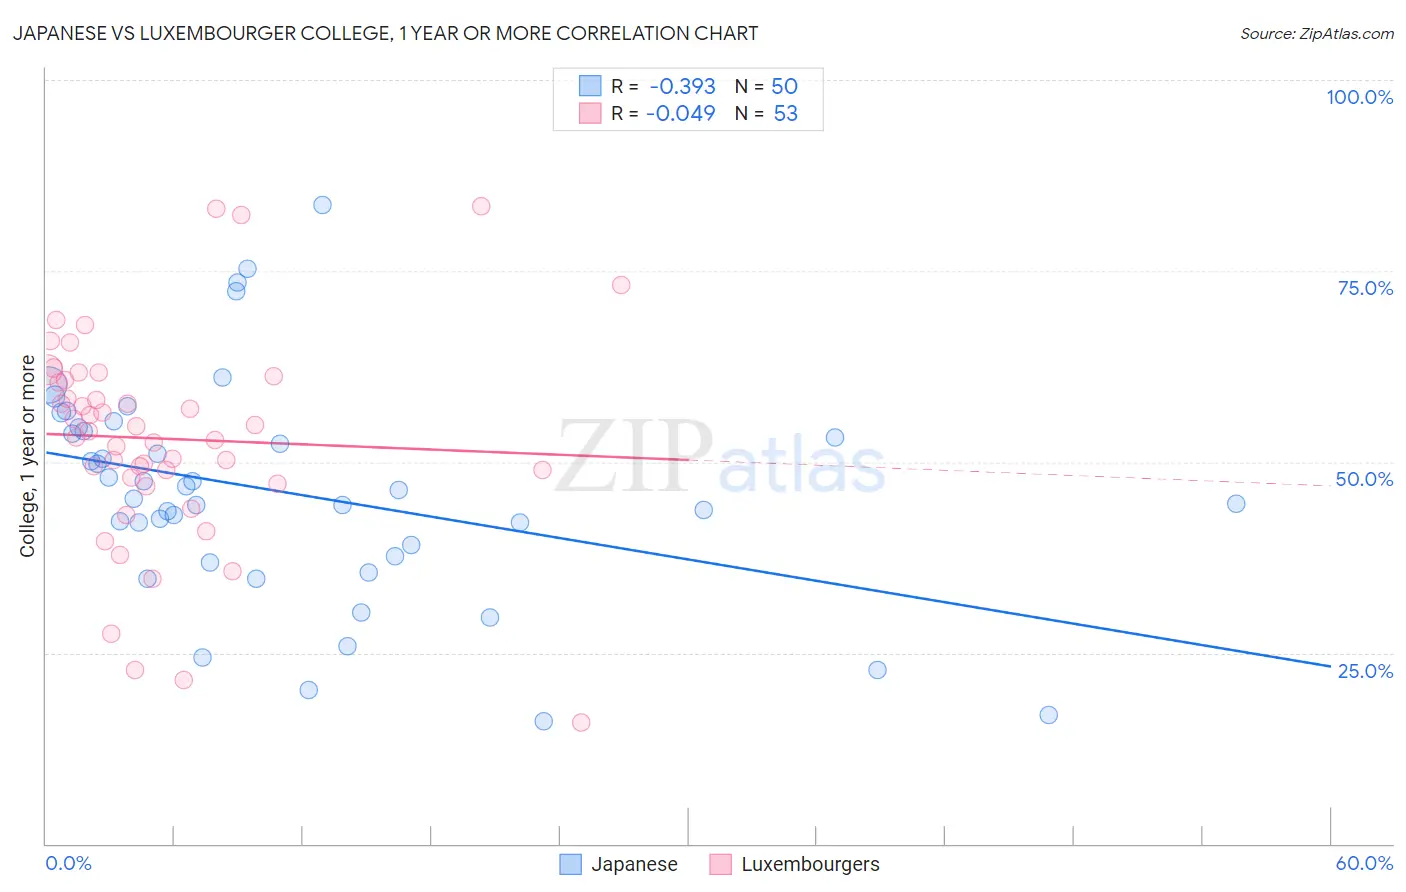
Japanese vs Luxembourger College, 1 year or more Correlation Chart
The statistical analysis conducted on geographies consisting of 249,181,552 people shows a mild negative correlation between the proportion of Japanese and percentage of population with at least college, 1 year or more education in the United States with a correlation coefficient (R) of -0.393 and weighted average of 55.2%. Similarly, the statistical analysis conducted on geographies consisting of 144,676,190 people shows no correlation between the proportion of Luxembourgers and percentage of population with at least college, 1 year or more education in the United States with a correlation coefficient (R) of -0.049 and weighted average of 62.1%, a difference of 12.4%.
College, 1 year or more Correlation Summary
| Measurement | Japanese | Luxembourger |
| Minimum | 16.1% | 15.8% |
| Maximum | 83.7% | 83.5% |
| Range | 67.6% | 67.6% |
| Mean | 45.9% | 53.0% |
| Median | 45.8% | 54.1% |
| Interquartile 25% (IQ1) | 37.6% | 47.5% |
| Interquartile 75% (IQ3) | 54.1% | 61.0% |
| Interquartile Range (IQR) | 16.5% | 13.4% |
| Standard Deviation (Sample) | 14.4% | 13.9% |
| Standard Deviation (Population) | 14.2% | 13.8% |
Similar Demographics by College, 1 year or more
Demographics Similar to Japanese by College, 1 year or more
In terms of college, 1 year or more, the demographic groups most similar to Japanese are Immigrants from Bahamas (55.2%, a difference of 0.050%), Immigrants from West Indies (55.2%, a difference of 0.12%), Indonesian (55.1%, a difference of 0.22%), Immigrants from Barbados (55.4%, a difference of 0.25%), and Aleut (55.4%, a difference of 0.36%).
| Demographics | Rating | Rank | College, 1 year or more |
| Hawaiians | 0.8 /100 | #247 | Tragic 55.6% |
| Immigrants | Congo | 0.8 /100 | #248 | Tragic 55.6% |
| Immigrants | Trinidad and Tobago | 0.7 /100 | #249 | Tragic 55.5% |
| Delaware | 0.7 /100 | #250 | Tragic 55.5% |
| Immigrants | Cambodia | 0.6 /100 | #251 | Tragic 55.4% |
| Aleuts | 0.6 /100 | #252 | Tragic 55.4% |
| Immigrants | Barbados | 0.6 /100 | #253 | Tragic 55.4% |
| Japanese | 0.5 /100 | #254 | Tragic 55.2% |
| Immigrants | Bahamas | 0.5 /100 | #255 | Tragic 55.2% |
| Immigrants | West Indies | 0.5 /100 | #256 | Tragic 55.2% |
| Indonesians | 0.4 /100 | #257 | Tragic 55.1% |
| Africans | 0.4 /100 | #258 | Tragic 55.0% |
| Nepalese | 0.3 /100 | #259 | Tragic 54.9% |
| Jamaicans | 0.3 /100 | #260 | Tragic 54.9% |
| Ottawa | 0.3 /100 | #261 | Tragic 54.9% |
Demographics Similar to Luxembourgers by College, 1 year or more
In terms of college, 1 year or more, the demographic groups most similar to Luxembourgers are Icelander (62.1%, a difference of 0.020%), Swedish (62.1%, a difference of 0.020%), Afghan (62.0%, a difference of 0.12%), Chilean (62.0%, a difference of 0.13%), and Immigrants from Nepal (62.0%, a difference of 0.15%).
| Demographics | Rating | Rank | College, 1 year or more |
| British | 97.4 /100 | #95 | Exceptional 62.3% |
| Chinese | 97.2 /100 | #96 | Exceptional 62.2% |
| Jordanians | 97.2 /100 | #97 | Exceptional 62.2% |
| Carpatho Rusyns | 97.2 /100 | #98 | Exceptional 62.2% |
| Croatians | 97.1 /100 | #99 | Exceptional 62.2% |
| Icelanders | 96.8 /100 | #100 | Exceptional 62.1% |
| Swedes | 96.8 /100 | #101 | Exceptional 62.1% |
| Luxembourgers | 96.7 /100 | #102 | Exceptional 62.1% |
| Afghans | 96.4 /100 | #103 | Exceptional 62.0% |
| Chileans | 96.4 /100 | #104 | Exceptional 62.0% |
| Immigrants | Nepal | 96.3 /100 | #105 | Exceptional 62.0% |
| Palestinians | 96.3 /100 | #106 | Exceptional 62.0% |
| Immigrants | Ukraine | 95.8 /100 | #107 | Exceptional 61.9% |
| Syrians | 95.7 /100 | #108 | Exceptional 61.9% |
| Immigrants | Northern Africa | 95.7 /100 | #109 | Exceptional 61.9% |