Shoshone vs Immigrants from Belgium College, 1 year or more
COMPARE
Shoshone
Immigrants from Belgium
College, 1 year or more
College, 1 year or more Comparison
Shoshone
Immigrants from Belgium
54.3%
COLLEGE, 1 YEAR OR MORE
0.2/ 100
METRIC RATING
276th/ 347
METRIC RANK
66.3%
COLLEGE, 1 YEAR OR MORE
100.0/ 100
METRIC RATING
24th/ 347
METRIC RANK
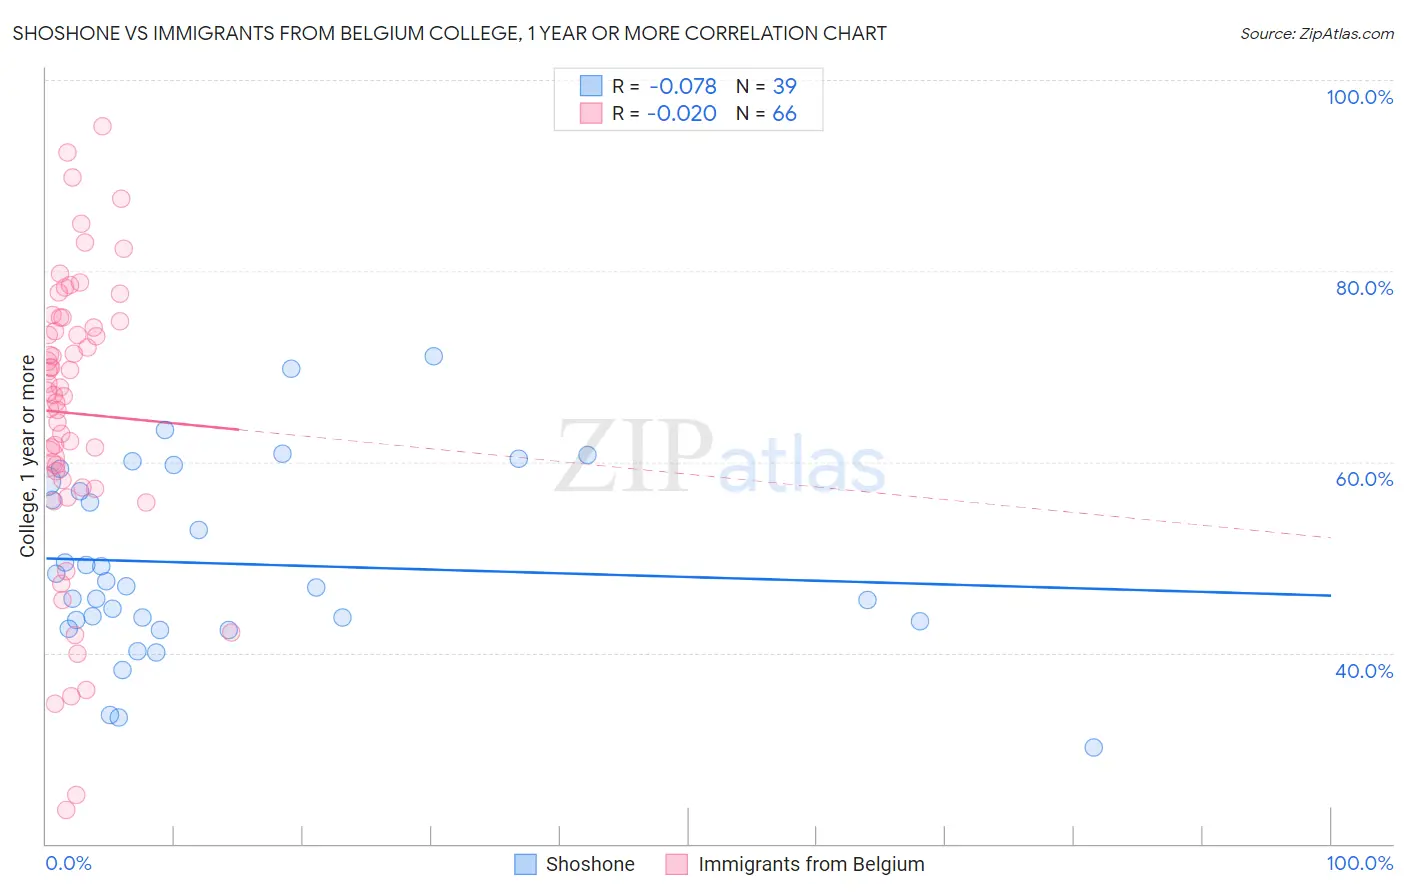
Shoshone vs Immigrants from Belgium College, 1 year or more Correlation Chart
The statistical analysis conducted on geographies consisting of 66,627,303 people shows a slight negative correlation between the proportion of Shoshone and percentage of population with at least college, 1 year or more education in the United States with a correlation coefficient (R) of -0.078 and weighted average of 54.3%. Similarly, the statistical analysis conducted on geographies consisting of 146,729,232 people shows no correlation between the proportion of Immigrants from Belgium and percentage of population with at least college, 1 year or more education in the United States with a correlation coefficient (R) of -0.020 and weighted average of 66.3%, a difference of 22.0%.
College, 1 year or more Correlation Summary
| Measurement | Shoshone | Immigrants from Belgium |
| Minimum | 30.1% | 23.6% |
| Maximum | 71.1% | 95.1% |
| Range | 41.0% | 71.6% |
| Mean | 49.3% | 65.1% |
| Median | 47.0% | 67.6% |
| Interquartile 25% (IQ1) | 43.3% | 58.2% |
| Interquartile 75% (IQ3) | 58.0% | 74.7% |
| Interquartile Range (IQR) | 14.7% | 16.5% |
| Standard Deviation (Sample) | 9.7% | 15.3% |
| Standard Deviation (Population) | 9.6% | 15.1% |
Similar Demographics by College, 1 year or more
Demographics Similar to Shoshone by College, 1 year or more
In terms of college, 1 year or more, the demographic groups most similar to Shoshone are Ecuadorian (54.3%, a difference of 0.040%), American (54.4%, a difference of 0.080%), Belizean (54.4%, a difference of 0.11%), Immigrants from Grenada (54.4%, a difference of 0.15%), and Comanche (54.4%, a difference of 0.18%).
| Demographics | Rating | Rank | College, 1 year or more |
| Bangladeshis | 0.2 /100 | #269 | Tragic 54.5% |
| Crow | 0.2 /100 | #270 | Tragic 54.5% |
| Bahamians | 0.2 /100 | #271 | Tragic 54.5% |
| Comanche | 0.2 /100 | #272 | Tragic 54.4% |
| Immigrants | Grenada | 0.2 /100 | #273 | Tragic 54.4% |
| Belizeans | 0.2 /100 | #274 | Tragic 54.4% |
| Americans | 0.2 /100 | #275 | Tragic 54.4% |
| Shoshone | 0.2 /100 | #276 | Tragic 54.3% |
| Ecuadorians | 0.2 /100 | #277 | Tragic 54.3% |
| Immigrants | Jamaica | 0.1 /100 | #278 | Tragic 54.2% |
| Arapaho | 0.1 /100 | #279 | Tragic 54.1% |
| Cheyenne | 0.1 /100 | #280 | Tragic 54.1% |
| Colville | 0.1 /100 | #281 | Tragic 54.1% |
| Guyanese | 0.1 /100 | #282 | Tragic 54.1% |
| Nicaraguans | 0.1 /100 | #283 | Tragic 53.9% |
Demographics Similar to Immigrants from Belgium by College, 1 year or more
In terms of college, 1 year or more, the demographic groups most similar to Immigrants from Belgium are Immigrants from China (66.4%, a difference of 0.080%), Soviet Union (66.4%, a difference of 0.14%), Immigrants from Hong Kong (66.4%, a difference of 0.20%), Immigrants from Korea (66.5%, a difference of 0.27%), and Immigrants from Switzerland (66.5%, a difference of 0.31%).
| Demographics | Rating | Rank | College, 1 year or more |
| Immigrants | Eastern Asia | 100.0 /100 | #17 | Exceptional 66.6% |
| Eastern Europeans | 100.0 /100 | #18 | Exceptional 66.6% |
| Immigrants | Switzerland | 100.0 /100 | #19 | Exceptional 66.5% |
| Immigrants | Korea | 100.0 /100 | #20 | Exceptional 66.5% |
| Immigrants | Hong Kong | 100.0 /100 | #21 | Exceptional 66.4% |
| Soviet Union | 100.0 /100 | #22 | Exceptional 66.4% |
| Immigrants | China | 100.0 /100 | #23 | Exceptional 66.4% |
| Immigrants | Belgium | 100.0 /100 | #24 | Exceptional 66.3% |
| Indians (Asian) | 100.0 /100 | #25 | Exceptional 66.1% |
| Latvians | 100.0 /100 | #26 | Exceptional 66.1% |
| Immigrants | Ireland | 100.0 /100 | #27 | Exceptional 65.9% |
| Immigrants | France | 100.0 /100 | #28 | Exceptional 65.8% |
| Immigrants | Northern Europe | 100.0 /100 | #29 | Exceptional 65.6% |
| Immigrants | Denmark | 100.0 /100 | #30 | Exceptional 65.6% |
| Turks | 100.0 /100 | #31 | Exceptional 65.5% |