Shoshone vs Luxembourger In Labor Force | Age 25-29
COMPARE
Shoshone
Luxembourger
In Labor Force | Age 25-29
In Labor Force | Age 25-29 Comparison
Shoshone
Luxembourgers
81.6%
IN LABOR FORCE | AGE 25-29
0.0/ 100
METRIC RATING
321st/ 347
METRIC RANK
86.9%
IN LABOR FORCE | AGE 25-29
100.0/ 100
METRIC RATING
5th/ 347
METRIC RANK
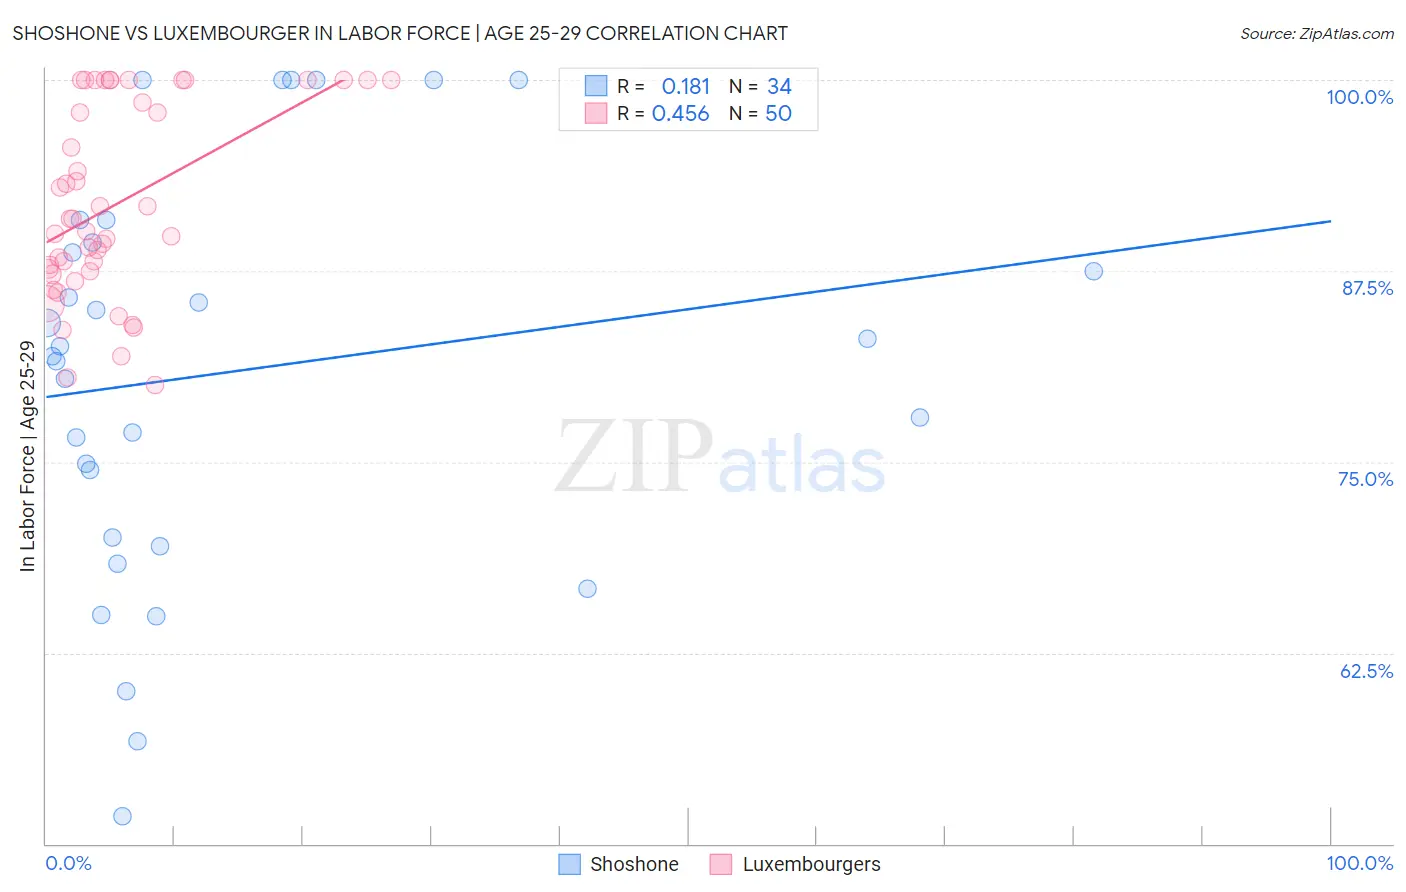
Shoshone vs Luxembourger In Labor Force | Age 25-29 Correlation Chart
The statistical analysis conducted on geographies consisting of 66,617,603 people shows a poor positive correlation between the proportion of Shoshone and labor force participation rate among population between the ages 25 and 29 in the United States with a correlation coefficient (R) of 0.181 and weighted average of 81.6%. Similarly, the statistical analysis conducted on geographies consisting of 144,653,840 people shows a moderate positive correlation between the proportion of Luxembourgers and labor force participation rate among population between the ages 25 and 29 in the United States with a correlation coefficient (R) of 0.456 and weighted average of 86.9%, a difference of 6.5%.
In Labor Force | Age 25-29 Correlation Summary
| Measurement | Shoshone | Luxembourger |
| Minimum | 51.8% | 80.0% |
| Maximum | 100.0% | 100.0% |
| Range | 48.2% | 20.0% |
| Mean | 80.9% | 91.9% |
| Median | 82.2% | 90.5% |
| Interquartile 25% (IQ1) | 70.1% | 87.5% |
| Interquartile 75% (IQ3) | 89.4% | 100.0% |
| Interquartile Range (IQR) | 19.3% | 12.5% |
| Standard Deviation (Sample) | 13.2% | 6.2% |
| Standard Deviation (Population) | 13.0% | 6.2% |
Similar Demographics by In Labor Force | Age 25-29
Demographics Similar to Shoshone by In Labor Force | Age 25-29
In terms of in labor force | age 25-29, the demographic groups most similar to Shoshone are Kiowa (81.6%, a difference of 0.010%), Colville (81.6%, a difference of 0.060%), Alaska Native (81.6%, a difference of 0.060%), Seminole (81.7%, a difference of 0.11%), and Comanche (81.9%, a difference of 0.32%).
| Demographics | Rating | Rank | In Labor Force | Age 25-29 |
| Cherokee | 0.0 /100 | #314 | Tragic 82.1% |
| Immigrants | Mexico | 0.0 /100 | #315 | Tragic 82.0% |
| Mexicans | 0.0 /100 | #316 | Tragic 81.9% |
| Chickasaw | 0.0 /100 | #317 | Tragic 81.9% |
| Comanche | 0.0 /100 | #318 | Tragic 81.9% |
| Seminole | 0.0 /100 | #319 | Tragic 81.7% |
| Colville | 0.0 /100 | #320 | Tragic 81.6% |
| Shoshone | 0.0 /100 | #321 | Tragic 81.6% |
| Kiowa | 0.0 /100 | #322 | Tragic 81.6% |
| Alaska Natives | 0.0 /100 | #323 | Tragic 81.6% |
| Houma | 0.0 /100 | #324 | Tragic 81.2% |
| Dutch West Indians | 0.0 /100 | #325 | Tragic 81.1% |
| Choctaw | 0.0 /100 | #326 | Tragic 81.0% |
| Ute | 0.0 /100 | #327 | Tragic 80.8% |
| Creek | 0.0 /100 | #328 | Tragic 80.7% |
Demographics Similar to Luxembourgers by In Labor Force | Age 25-29
In terms of in labor force | age 25-29, the demographic groups most similar to Luxembourgers are Carpatho Rusyn (87.0%, a difference of 0.10%), Immigrants from Somalia (87.1%, a difference of 0.19%), Somali (87.1%, a difference of 0.19%), Slovene (86.4%, a difference of 0.62%), and Immigrants from Bosnia and Herzegovina (86.3%, a difference of 0.74%).
| Demographics | Rating | Rank | In Labor Force | Age 25-29 |
| Tsimshian | 100.0 /100 | #1 | Exceptional 88.7% |
| Immigrants | Somalia | 100.0 /100 | #2 | Exceptional 87.1% |
| Somalis | 100.0 /100 | #3 | Exceptional 87.1% |
| Carpatho Rusyns | 100.0 /100 | #4 | Exceptional 87.0% |
| Luxembourgers | 100.0 /100 | #5 | Exceptional 86.9% |
| Slovenes | 100.0 /100 | #6 | Exceptional 86.4% |
| Immigrants | Bosnia and Herzegovina | 100.0 /100 | #7 | Exceptional 86.3% |
| Immigrants | Cabo Verde | 100.0 /100 | #8 | Exceptional 86.2% |
| Ethiopians | 100.0 /100 | #9 | Exceptional 86.2% |
| Liberians | 100.0 /100 | #10 | Exceptional 86.1% |
| Immigrants | Ethiopia | 100.0 /100 | #11 | Exceptional 86.1% |
| Immigrants | Lithuania | 100.0 /100 | #12 | Exceptional 86.1% |
| Norwegians | 100.0 /100 | #13 | Exceptional 86.1% |
| Latvians | 100.0 /100 | #14 | Exceptional 86.1% |
| Bolivians | 100.0 /100 | #15 | Exceptional 86.1% |