Slovene vs Luxembourger College, 1 year or more

COMPARE

Slovene
Race
Ancestry
AfghanAfricanAlaska NativeAlaskan AthabascanAlbanianAleutAlsatianAmericanApacheArabArapahoArgentineanArmenianAssyrian/Chaldean/SyriacAustralianAustrianBahamianBangladeshiBarbadianBasqueBelgianBelizeanBermudanBhutaneseBlackfeetBolivianBrazilianBritishBritish West IndianBulgarianBurmeseCajunCambodianCanadianCape VerdeanCarpatho RusynCelticCentral AmericanCentral American IndianCherokeeCheyenneChickasawChileanChineseChippewaChoctawColombianColvilleComancheCosta RicanCreeCreekCroatianCrowCubanCypriotCzechCzechoslovakianDanishDelawareDominicanDutchDutch West IndianEastern EuropeanEcuadorianEgyptianEnglishEstonianEthiopianEuropeanFijianFilipinoFinnishFrenchFrench American IndianFrench CanadianGermanGerman RussianGhanaianGreekGuamanian/ChamorroGuatemalanGuyaneseHaitianHmongHonduranHopiHoumaHungarianIcelanderIndian (Asian)IndonesianInupiatIranianIraqiIrishIroquoisIsraeliItalianJamaicanJapaneseJordanianKenyanKiowaKoreanLaotianLatvianLebaneseLiberianLithuanianLumbeeMacedonianMalaysianMalteseMarshalleseMenomineeMexicanMexican American IndianMongolianMoroccanNative HawaiianNavajoNepaleseNew ZealanderNicaraguanNigerianNorthern EuropeanNorwegianOkinawanOsageOttawaPaiutePakistaniPalestinianPanamanianParaguayanPennsylvania GermanPeruvianPimaPolishPortuguesePotawatomiPuebloPuerto RicanPuget Sound SalishRomanianRussianSalvadoranSamoanScandinavianScotch-IrishScottishSeminoleSenegaleseSerbianShoshoneSierra LeoneanSiouxSlavicSlovakSloveneSomaliSouth AfricanSouth AmericanSouth American IndianSoviet UnionSpaniardSpanishSpanish AmericanSpanish American IndianSri LankanSubsaharan AfricanSudaneseSwedishSwissSyrianTaiwaneseThaiTlingit-HaidaTohono O'OdhamTonganTrinidadian and TobagonianTsimshianTurkishU.S. Virgin IslanderUgandanUkrainianUruguayanUteVenezuelanVietnameseWelshWest IndianYakamaYaquiYugoslavianYumanYup'ikZimbabwean
Immigration
NonimmigrantsImmigrantsAfghanistanAfricaAlbaniaArgentinaArmeniaAsiaAustraliaAustriaBahamasBangladeshBarbadosBelarusBelgiumBelizeBoliviaBosnia and HerzegovinaBrazilBulgariaBurma/MyanmarCabo VerdeCambodiaCameroonCanadaCaribbeanCentral AmericaChileChinaColombiaCongoCosta RicaCroatiaCubaCzechoslovakiaDenmarkDominicaDominican RepublicEastern AfricaEastern AsiaEastern EuropeEcuadorEgyptEl SalvadorEnglandEritreaEthiopiaEuropeFijiFranceGermanyGhanaGreeceGrenadaGuatemalaGuyanaHaitiHondurasHong KongHungaryIndiaIndonesiaIranIraqIrelandIsraelItalyJamaicaJapanJordanKazakhstanKenyaKoreaKuwaitLaosLatin AmericaLatviaLebanonLiberiaLithuaniaMalaysiaMexicoMicronesiaMiddle AfricaMoldovaMoroccoNepalNetherlandsNicaraguaNigeriaNorth AmericaNorth MacedoniaNorthern AfricaNorthern EuropeNorwayOceaniaPakistanPanamaPeruPhilippinesPolandPortugalRomaniaRussiaSaudi ArabiaScotlandSenegalSerbiaSierra LeoneSingaporeSomaliaSouth AfricaSouth AmericaSouth Central AsiaSouth Eastern AsiaSouthern EuropeSpainSri LankaSt. Vincent and the GrenadinesSudanSwedenSwitzerlandSyriaTaiwanThailandTrinidad and TobagoTurkeyUgandaUkraineUruguayUzbekistanVenezuelaVietnamWest IndiesWestern AfricaWestern AsiaWestern EuropeYemenZaireZimbabweAzores
Luxembourger
Race
Ancestry
AfghanAfricanAlaska NativeAlaskan AthabascanAlbanianAleutAlsatianAmericanApacheArabArapahoArgentineanArmenianAssyrian/Chaldean/SyriacAustralianAustrianBahamianBangladeshiBarbadianBasqueBelgianBelizeanBermudanBhutaneseBlackfeetBolivianBrazilianBritishBritish West IndianBulgarianBurmeseCajunCambodianCanadianCape VerdeanCarpatho RusynCelticCentral AmericanCentral American IndianCherokeeCheyenneChickasawChileanChineseChippewaChoctawColombianColvilleComancheCosta RicanCreeCreekCroatianCrowCubanCypriotCzechCzechoslovakianDanishDelawareDominicanDutchDutch West IndianEastern EuropeanEcuadorianEgyptianEnglishEstonianEthiopianEuropeanFijianFilipinoFinnishFrenchFrench American IndianFrench CanadianGermanGerman RussianGhanaianGreekGuamanian/ChamorroGuatemalanGuyaneseHaitianHmongHonduranHopiHoumaHungarianIcelanderIndian (Asian)IndonesianInupiatIranianIraqiIrishIroquoisIsraeliItalianJamaicanJapaneseJordanianKenyanKiowaKoreanLaotianLatvianLebaneseLiberianLithuanianLumbeeLuxembourgerMacedonianMalaysianMalteseMarshalleseMenomineeMexicanMexican American IndianMongolianMoroccanNative HawaiianNavajoNepaleseNew ZealanderNicaraguanNigerianNorthern EuropeanNorwegianOkinawanOsageOttawaPaiutePakistaniPalestinianPanamanianParaguayanPennsylvania GermanPeruvianPimaPolishPortuguesePotawatomiPuebloPuerto RicanPuget Sound SalishRomanianRussianSalvadoranSamoanScandinavianScotch-IrishScottishSeminoleSenegaleseSerbianShoshoneSierra LeoneanSiouxSlavicSlovakSomaliSouth AfricanSouth AmericanSouth American IndianSoviet UnionSpaniardSpanishSpanish AmericanSpanish American IndianSri LankanSubsaharan AfricanSudaneseSwedishSwissSyrianTaiwaneseThaiTlingit-HaidaTohono O'OdhamTonganTrinidadian and TobagonianTsimshianTurkishU.S. Virgin IslanderUgandanUkrainianUruguayanUteVenezuelanVietnameseWelshWest IndianYakamaYaquiYugoslavianYumanYup'ikZimbabwean
Immigration
NonimmigrantsImmigrantsAfghanistanAfricaAlbaniaArgentinaArmeniaAsiaAustraliaAustriaBahamasBangladeshBarbadosBelarusBelgiumBelizeBoliviaBosnia and HerzegovinaBrazilBulgariaBurma/MyanmarCabo VerdeCambodiaCameroonCanadaCaribbeanCentral AmericaChileChinaColombiaCongoCosta RicaCroatiaCubaCzechoslovakiaDenmarkDominicaDominican RepublicEastern AfricaEastern AsiaEastern EuropeEcuadorEgyptEl SalvadorEnglandEritreaEthiopiaEuropeFijiFranceGermanyGhanaGreeceGrenadaGuatemalaGuyanaHaitiHondurasHong KongHungaryIndiaIndonesiaIranIraqIrelandIsraelItalyJamaicaJapanJordanKazakhstanKenyaKoreaKuwaitLaosLatin AmericaLatviaLebanonLiberiaLithuaniaMalaysiaMexicoMicronesiaMiddle AfricaMoldovaMoroccoNepalNetherlandsNicaraguaNigeriaNorth AmericaNorth MacedoniaNorthern AfricaNorthern EuropeNorwayOceaniaPakistanPanamaPeruPhilippinesPolandPortugalRomaniaRussiaSaudi ArabiaScotlandSenegalSerbiaSierra LeoneSingaporeSomaliaSouth AfricaSouth AmericaSouth Central AsiaSouth Eastern AsiaSouthern EuropeSpainSri LankaSt. Vincent and the GrenadinesSudanSwedenSwitzerlandSyriaTaiwanThailandTrinidad and TobagoTurkeyUgandaUkraineUruguayUzbekistanVenezuelaVietnamWest IndiesWestern AfricaWestern AsiaWestern EuropeYemenZaireZimbabweAzores
College, 1 year or more
Income
Poverty
Unemployment
Labor Participation
Family Structure
Vehicle Availability
Education Level
Disability

College, 1 year or more Comparison

Slovenes

Luxembourgers

Excellent
Exceptional
60.9%
COLLEGE, 1 YEAR OR MORE
86.5/ 100
METRIC RATING
137th/ 347
METRIC RANK
62.1%
COLLEGE, 1 YEAR OR MORE
96.7/ 100
METRIC RATING
102nd/ 347
METRIC RANK

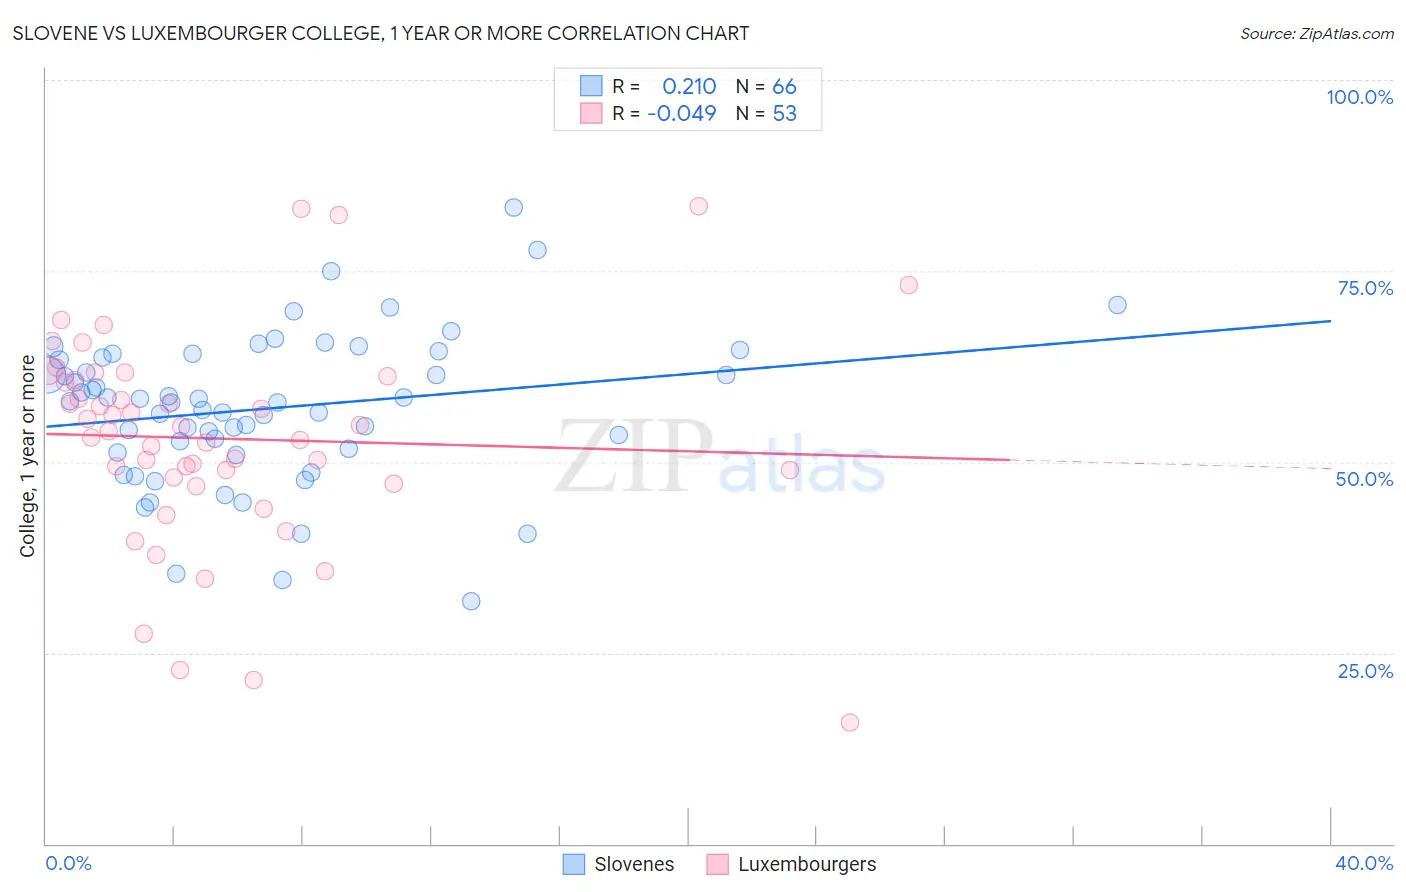
Slovene vs Luxembourger College, 1 year or more Correlation Chart

The statistical analysis conducted on geographies consisting of 261,353,489 people shows a weak positive correlation between the proportion of Slovenes and percentage of population with at least college, 1 year or more education in the United States with a correlation coefficient (R) of 0.210 and weighted average of 60.9%. Similarly, the statistical analysis conducted on geographies consisting of 144,676,190 people shows no correlation between the proportion of Luxembourgers and percentage of population with at least college, 1 year or more education in the United States with a correlation coefficient (R) of -0.049 and weighted average of 62.1%, a difference of 2.0%.
Slovene vs Luxembourger College, 1 year or more

College, 1 year or more Correlation Summary

MeasurementSloveneLuxembourger
Minimum31.8%15.8%
Maximum83.3%83.5%
Range51.5%67.6%
Mean57.0%53.0%
Median57.9%54.1%
Interquartile 25% (IQ1)51.8%47.5%
Interquartile 75% (IQ3)63.6%61.0%
Interquartile Range (IQR)11.8%13.4%
Standard Deviation (Sample)9.8%13.9%
Standard Deviation (Population)9.7%13.8%

Similar Demographics by College, 1 year or more

Demographics Similar to Slovenes by College, 1 year or more

In terms of college, 1 year or more, the demographic groups most similar to Slovenes are Basque (60.9%, a difference of 0.090%), Immigrants from Uganda (60.9%, a difference of 0.11%), Immigrants from Venezuela (61.0%, a difference of 0.16%), Immigrants from Uzbekistan (61.0%, a difference of 0.18%), and Scandinavian (61.0%, a difference of 0.20%).
DemographicsRating | RankCollege, 1 year or more
Italians
89.5
/100
|
#130
Excellent
61.1%
Immigrants | Morocco
89.5
/100
|
#131
Excellent
61.1%
Scandinavians
88.2
/100
|
#132
Excellent
61.0%
Immigrants | Uzbekistan
88.0
/100
|
#133
Excellent
61.0%
Immigrants | Venezuela
87.9
/100
|
#134
Excellent
61.0%
Immigrants | Uganda
87.4
/100
|
#135
Excellent
60.9%
Basques
87.2
/100
|
#136
Excellent
60.9%
Slovenes
86.5
/100
|
#137
Excellent
60.9%
Taiwanese
84.3
/100
|
#138
Excellent
60.7%
Immigrants | Eritrea
84.3
/100
|
#139
Excellent
60.7%
Iraqis
83.3
/100
|
#140
Excellent
60.7%
Immigrants | Afghanistan
83.1
/100
|
#141
Excellent
60.7%
Poles
82.8
/100
|
#142
Excellent
60.7%
Canadians
82.7
/100
|
#143
Excellent
60.6%
Czechs
81.9
/100
|
#144
Excellent
60.6%

Demographics Similar to Luxembourgers by College, 1 year or more

In terms of college, 1 year or more, the demographic groups most similar to Luxembourgers are Icelander (62.1%, a difference of 0.020%), Swedish (62.1%, a difference of 0.020%), Afghan (62.0%, a difference of 0.12%), Chilean (62.0%, a difference of 0.13%), and Immigrants from Nepal (62.0%, a difference of 0.15%).
DemographicsRating | RankCollege, 1 year or more
British
97.4
/100
|
#95
Exceptional
62.3%
Chinese
97.2
/100
|
#96
Exceptional
62.2%
Jordanians
97.2
/100
|
#97
Exceptional
62.2%
Carpatho Rusyns
97.2
/100
|
#98
Exceptional
62.2%
Croatians
97.1
/100
|
#99
Exceptional
62.2%
Icelanders
96.8
/100
|
#100
Exceptional
62.1%
Swedes
96.8
/100
|
#101
Exceptional
62.1%
Luxembourgers
96.7
/100
|
#102
Exceptional
62.1%
Afghans
96.4
/100
|
#103
Exceptional
62.0%
Chileans
96.4
/100
|
#104
Exceptional
62.0%
Immigrants | Nepal
96.3
/100
|
#105
Exceptional
62.0%
Palestinians
96.3
/100
|
#106
Exceptional
62.0%
Immigrants | Ukraine
95.8
/100
|
#107
Exceptional
61.9%
Syrians
95.7
/100
|
#108
Exceptional
61.9%
Immigrants | Northern Africa
95.7
/100
|
#109
Exceptional
61.9%