Shoshone vs Egyptian College, 1 year or more
COMPARE
Shoshone
Egyptian
College, 1 year or more
College, 1 year or more Comparison
Shoshone
Egyptians
54.3%
COLLEGE, 1 YEAR OR MORE
0.2/ 100
METRIC RATING
276th/ 347
METRIC RANK
63.1%
COLLEGE, 1 YEAR OR MORE
99.0/ 100
METRIC RATING
72nd/ 347
METRIC RANK
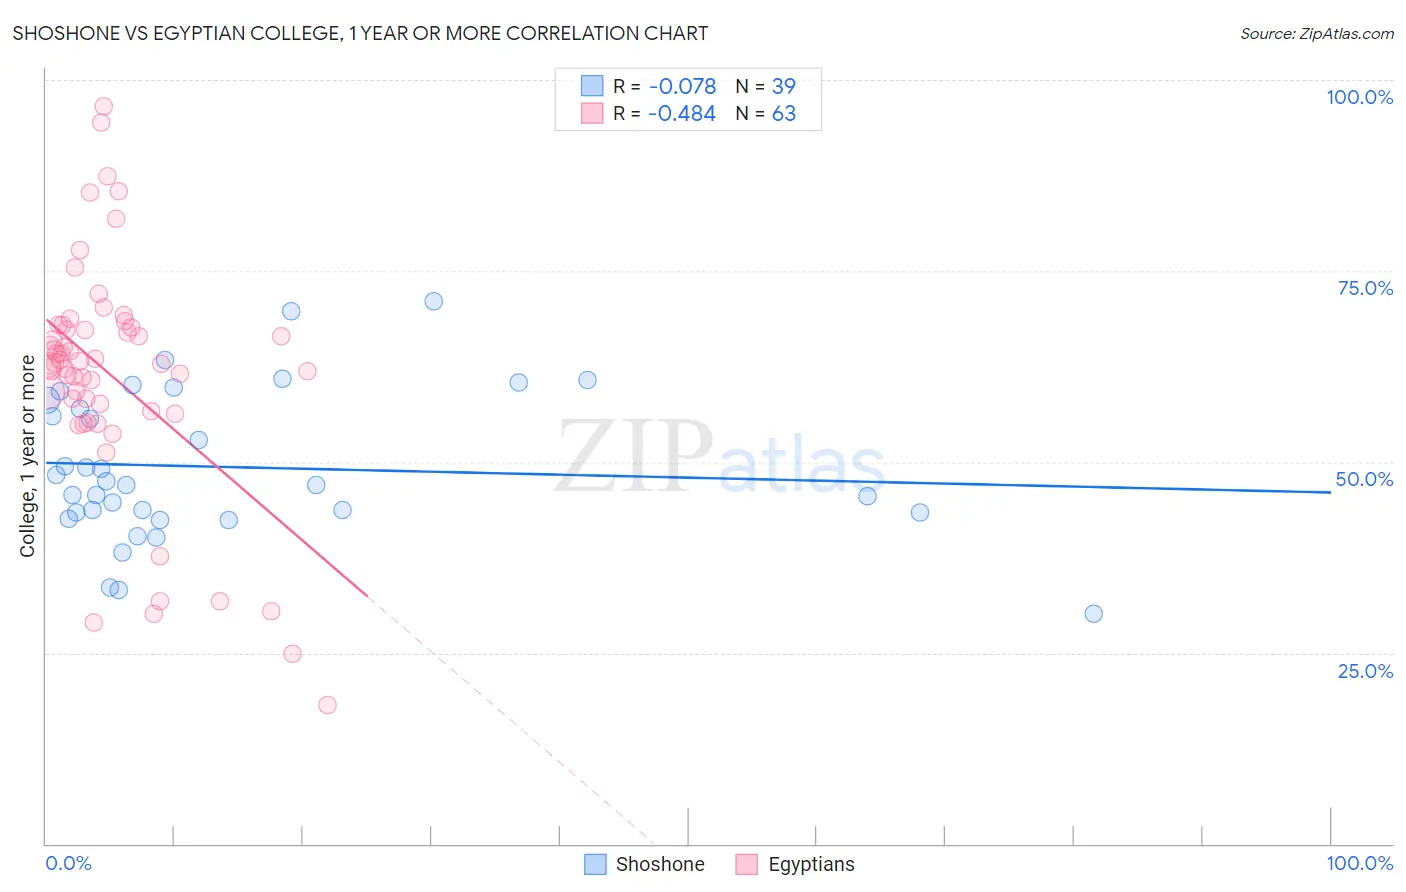
Shoshone vs Egyptian College, 1 year or more Correlation Chart
The statistical analysis conducted on geographies consisting of 66,627,303 people shows a slight negative correlation between the proportion of Shoshone and percentage of population with at least college, 1 year or more education in the United States with a correlation coefficient (R) of -0.078 and weighted average of 54.3%. Similarly, the statistical analysis conducted on geographies consisting of 276,926,367 people shows a moderate negative correlation between the proportion of Egyptians and percentage of population with at least college, 1 year or more education in the United States with a correlation coefficient (R) of -0.484 and weighted average of 63.1%, a difference of 16.0%.
College, 1 year or more Correlation Summary
| Measurement | Shoshone | Egyptian |
| Minimum | 30.1% | 18.2% |
| Maximum | 71.1% | 96.6% |
| Range | 41.0% | 78.4% |
| Mean | 49.3% | 61.3% |
| Median | 47.0% | 62.9% |
| Interquartile 25% (IQ1) | 43.3% | 56.7% |
| Interquartile 75% (IQ3) | 58.0% | 67.5% |
| Interquartile Range (IQR) | 14.7% | 10.9% |
| Standard Deviation (Sample) | 9.7% | 15.4% |
| Standard Deviation (Population) | 9.6% | 15.3% |
Similar Demographics by College, 1 year or more
Demographics Similar to Shoshone by College, 1 year or more
In terms of college, 1 year or more, the demographic groups most similar to Shoshone are Ecuadorian (54.3%, a difference of 0.040%), American (54.4%, a difference of 0.080%), Belizean (54.4%, a difference of 0.11%), Immigrants from Grenada (54.4%, a difference of 0.15%), and Comanche (54.4%, a difference of 0.18%).
| Demographics | Rating | Rank | College, 1 year or more |
| Bangladeshis | 0.2 /100 | #269 | Tragic 54.5% |
| Crow | 0.2 /100 | #270 | Tragic 54.5% |
| Bahamians | 0.2 /100 | #271 | Tragic 54.5% |
| Comanche | 0.2 /100 | #272 | Tragic 54.4% |
| Immigrants | Grenada | 0.2 /100 | #273 | Tragic 54.4% |
| Belizeans | 0.2 /100 | #274 | Tragic 54.4% |
| Americans | 0.2 /100 | #275 | Tragic 54.4% |
| Shoshone | 0.2 /100 | #276 | Tragic 54.3% |
| Ecuadorians | 0.2 /100 | #277 | Tragic 54.3% |
| Immigrants | Jamaica | 0.1 /100 | #278 | Tragic 54.2% |
| Arapaho | 0.1 /100 | #279 | Tragic 54.1% |
| Cheyenne | 0.1 /100 | #280 | Tragic 54.1% |
| Colville | 0.1 /100 | #281 | Tragic 54.1% |
| Guyanese | 0.1 /100 | #282 | Tragic 54.1% |
| Nicaraguans | 0.1 /100 | #283 | Tragic 53.9% |
Demographics Similar to Egyptians by College, 1 year or more
In terms of college, 1 year or more, the demographic groups most similar to Egyptians are Immigrants from Moldova (63.0%, a difference of 0.010%), Immigrants from North America (63.0%, a difference of 0.030%), Immigrants from Canada (63.1%, a difference of 0.060%), Armenian (63.0%, a difference of 0.12%), and Paraguayan (62.9%, a difference of 0.22%).
| Demographics | Rating | Rank | College, 1 year or more |
| Maltese | 99.3 /100 | #65 | Exceptional 63.4% |
| Immigrants | Europe | 99.3 /100 | #66 | Exceptional 63.3% |
| Immigrants | Romania | 99.3 /100 | #67 | Exceptional 63.3% |
| Immigrants | Greece | 99.3 /100 | #68 | Exceptional 63.3% |
| Immigrants | Zimbabwe | 99.3 /100 | #69 | Exceptional 63.3% |
| Argentineans | 99.2 /100 | #70 | Exceptional 63.2% |
| Immigrants | Canada | 99.1 /100 | #71 | Exceptional 63.1% |
| Egyptians | 99.0 /100 | #72 | Exceptional 63.1% |
| Immigrants | Moldova | 99.0 /100 | #73 | Exceptional 63.0% |
| Immigrants | North America | 99.0 /100 | #74 | Exceptional 63.0% |
| Armenians | 98.9 /100 | #75 | Exceptional 63.0% |
| Paraguayans | 98.8 /100 | #76 | Exceptional 62.9% |
| Ethiopians | 98.8 /100 | #77 | Exceptional 62.9% |
| Immigrants | Lebanon | 98.8 /100 | #78 | Exceptional 62.9% |
| Northern Europeans | 98.8 /100 | #79 | Exceptional 62.9% |