Immigrants from Caribbean vs Luxembourger College, 1 year or more
COMPARE
Immigrants from Caribbean
Luxembourger
College, 1 year or more
College, 1 year or more Comparison
Immigrants from Caribbean
Luxembourgers
51.4%
COLLEGE, 1 YEAR OR MORE
0.0/ 100
METRIC RATING
313th/ 347
METRIC RANK
62.1%
COLLEGE, 1 YEAR OR MORE
96.7/ 100
METRIC RATING
102nd/ 347
METRIC RANK
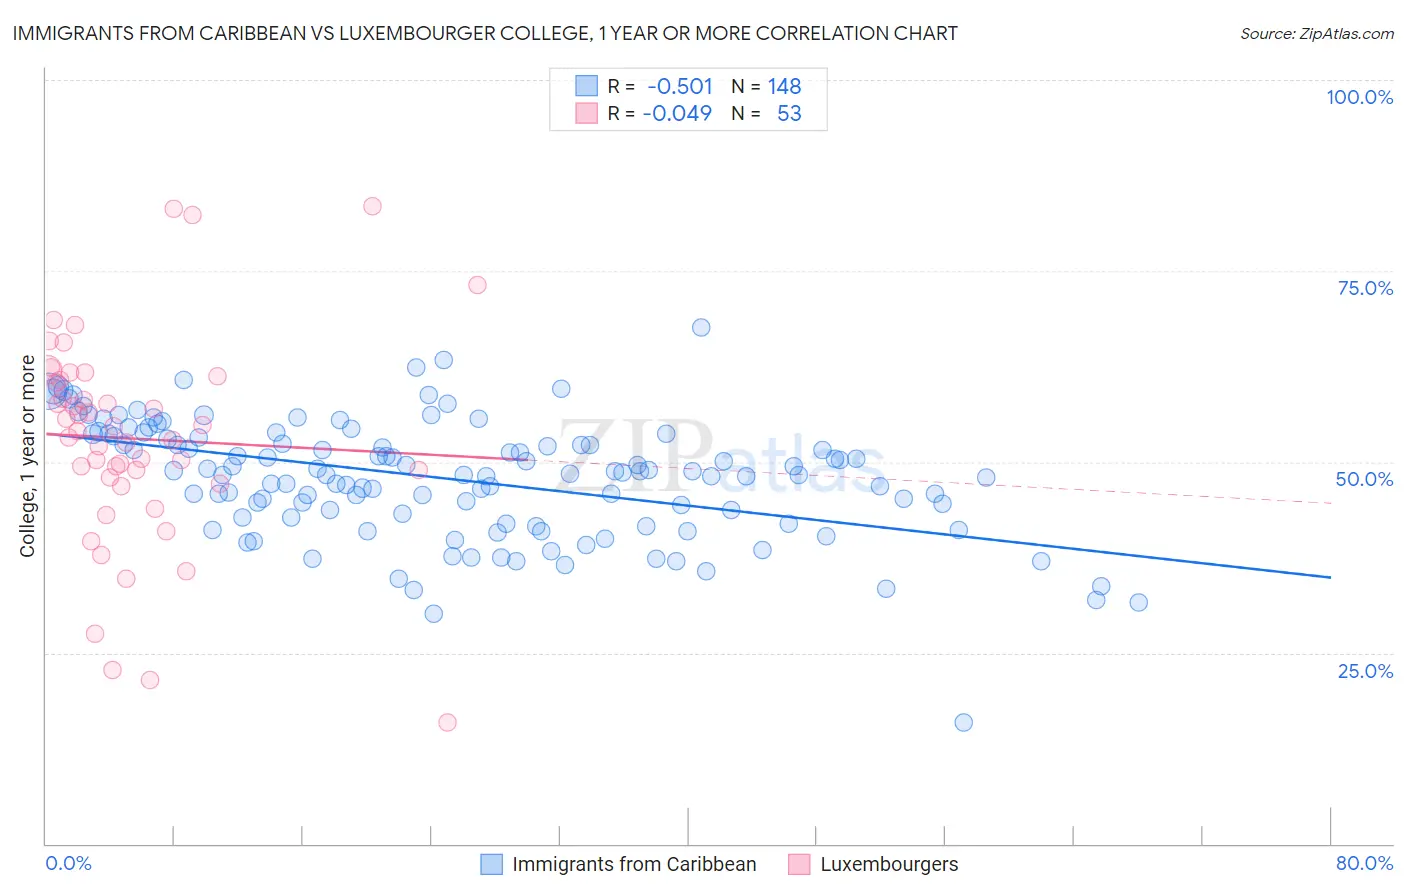
Immigrants from Caribbean vs Luxembourger College, 1 year or more Correlation Chart
The statistical analysis conducted on geographies consisting of 450,060,902 people shows a substantial negative correlation between the proportion of Immigrants from Caribbean and percentage of population with at least college, 1 year or more education in the United States with a correlation coefficient (R) of -0.501 and weighted average of 51.4%. Similarly, the statistical analysis conducted on geographies consisting of 144,676,190 people shows no correlation between the proportion of Luxembourgers and percentage of population with at least college, 1 year or more education in the United States with a correlation coefficient (R) of -0.049 and weighted average of 62.1%, a difference of 20.7%.
College, 1 year or more Correlation Summary
| Measurement | Immigrants from Caribbean | Luxembourger |
| Minimum | 15.9% | 15.8% |
| Maximum | 67.7% | 83.5% |
| Range | 51.8% | 67.6% |
| Mean | 47.8% | 53.0% |
| Median | 48.6% | 54.1% |
| Interquartile 25% (IQ1) | 42.7% | 47.5% |
| Interquartile 75% (IQ3) | 53.3% | 61.0% |
| Interquartile Range (IQR) | 10.6% | 13.4% |
| Standard Deviation (Sample) | 7.8% | 13.9% |
| Standard Deviation (Population) | 7.7% | 13.8% |
Similar Demographics by College, 1 year or more
Demographics Similar to Immigrants from Caribbean by College, 1 year or more
In terms of college, 1 year or more, the demographic groups most similar to Immigrants from Caribbean are Pueblo (51.5%, a difference of 0.13%), Immigrants from Haiti (51.5%, a difference of 0.17%), Fijian (51.3%, a difference of 0.22%), Honduran (51.6%, a difference of 0.33%), and Guatemalan (51.2%, a difference of 0.45%).
| Demographics | Rating | Rank | College, 1 year or more |
| Mexican American Indians | 0.0 /100 | #306 | Tragic 51.9% |
| Immigrants | Portugal | 0.0 /100 | #307 | Tragic 51.9% |
| Salvadorans | 0.0 /100 | #308 | Tragic 51.8% |
| Apache | 0.0 /100 | #309 | Tragic 51.8% |
| Hondurans | 0.0 /100 | #310 | Tragic 51.6% |
| Immigrants | Haiti | 0.0 /100 | #311 | Tragic 51.5% |
| Pueblo | 0.0 /100 | #312 | Tragic 51.5% |
| Immigrants | Caribbean | 0.0 /100 | #313 | Tragic 51.4% |
| Fijians | 0.0 /100 | #314 | Tragic 51.3% |
| Guatemalans | 0.0 /100 | #315 | Tragic 51.2% |
| Cajuns | 0.0 /100 | #316 | Tragic 51.2% |
| Hispanics or Latinos | 0.0 /100 | #317 | Tragic 51.1% |
| Immigrants | Honduras | 0.0 /100 | #318 | Tragic 51.0% |
| Immigrants | El Salvador | 0.0 /100 | #319 | Tragic 51.0% |
| Kiowa | 0.0 /100 | #320 | Tragic 51.0% |
Demographics Similar to Luxembourgers by College, 1 year or more
In terms of college, 1 year or more, the demographic groups most similar to Luxembourgers are Icelander (62.1%, a difference of 0.020%), Swedish (62.1%, a difference of 0.020%), Afghan (62.0%, a difference of 0.12%), Chilean (62.0%, a difference of 0.13%), and Immigrants from Nepal (62.0%, a difference of 0.15%).
| Demographics | Rating | Rank | College, 1 year or more |
| British | 97.4 /100 | #95 | Exceptional 62.3% |
| Chinese | 97.2 /100 | #96 | Exceptional 62.2% |
| Jordanians | 97.2 /100 | #97 | Exceptional 62.2% |
| Carpatho Rusyns | 97.2 /100 | #98 | Exceptional 62.2% |
| Croatians | 97.1 /100 | #99 | Exceptional 62.2% |
| Icelanders | 96.8 /100 | #100 | Exceptional 62.1% |
| Swedes | 96.8 /100 | #101 | Exceptional 62.1% |
| Luxembourgers | 96.7 /100 | #102 | Exceptional 62.1% |
| Afghans | 96.4 /100 | #103 | Exceptional 62.0% |
| Chileans | 96.4 /100 | #104 | Exceptional 62.0% |
| Immigrants | Nepal | 96.3 /100 | #105 | Exceptional 62.0% |
| Palestinians | 96.3 /100 | #106 | Exceptional 62.0% |
| Immigrants | Ukraine | 95.8 /100 | #107 | Exceptional 61.9% |
| Syrians | 95.7 /100 | #108 | Exceptional 61.9% |
| Immigrants | Northern Africa | 95.7 /100 | #109 | Exceptional 61.9% |