Shoshone vs Seminole College, 1 year or more
COMPARE
Shoshone
Seminole
College, 1 year or more
College, 1 year or more Comparison
Shoshone
Seminole
54.3%
COLLEGE, 1 YEAR OR MORE
0.2/ 100
METRIC RATING
276th/ 347
METRIC RANK
52.1%
COLLEGE, 1 YEAR OR MORE
0.0/ 100
METRIC RATING
305th/ 347
METRIC RANK
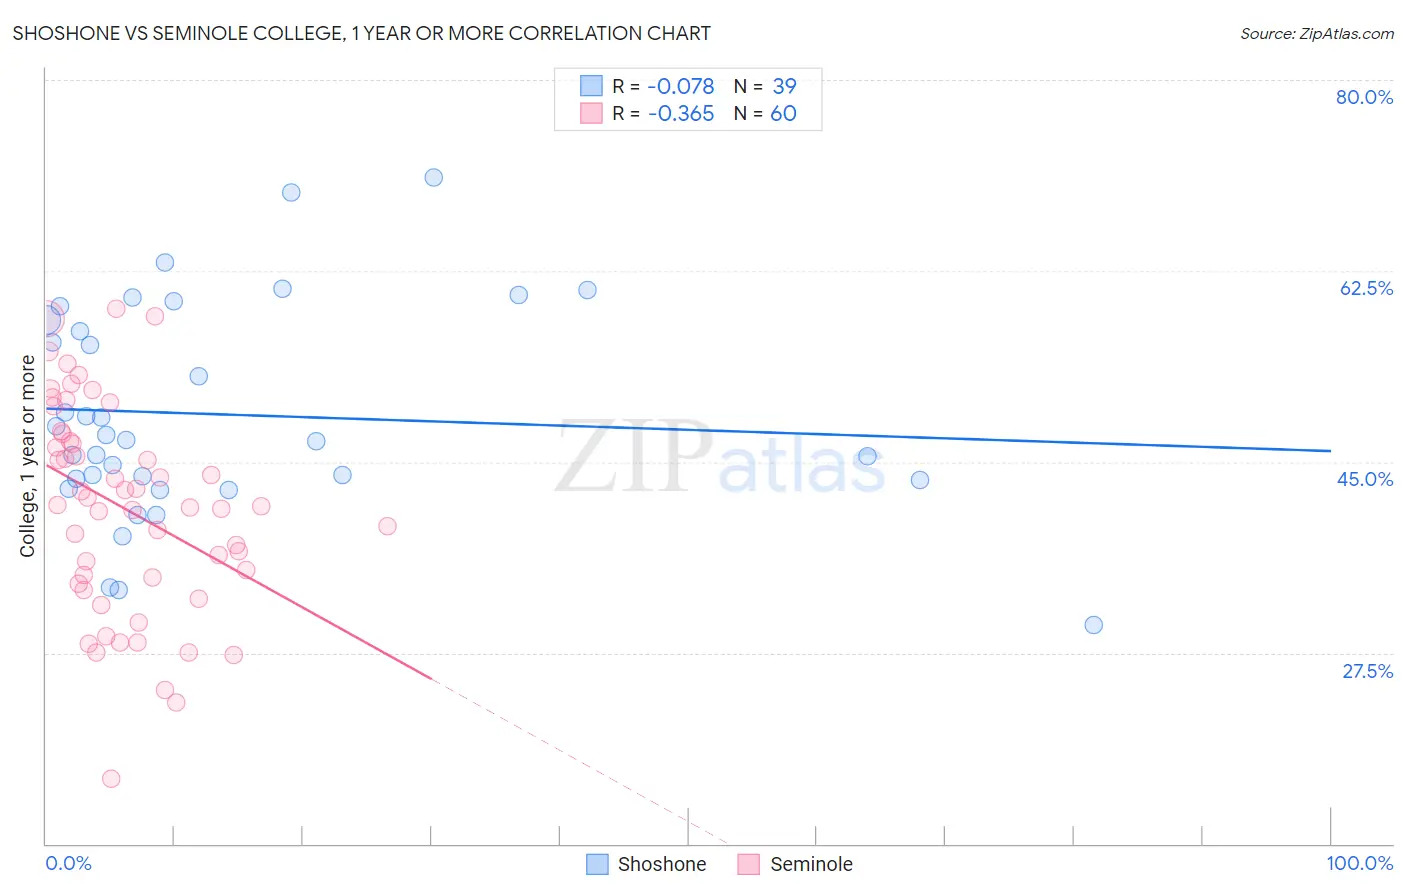
Shoshone vs Seminole College, 1 year or more Correlation Chart
The statistical analysis conducted on geographies consisting of 66,627,303 people shows a slight negative correlation between the proportion of Shoshone and percentage of population with at least college, 1 year or more education in the United States with a correlation coefficient (R) of -0.078 and weighted average of 54.3%. Similarly, the statistical analysis conducted on geographies consisting of 118,314,121 people shows a mild negative correlation between the proportion of Seminole and percentage of population with at least college, 1 year or more education in the United States with a correlation coefficient (R) of -0.365 and weighted average of 52.1%, a difference of 4.3%.
College, 1 year or more Correlation Summary
| Measurement | Shoshone | Seminole |
| Minimum | 30.1% | 15.9% |
| Maximum | 71.1% | 59.0% |
| Range | 41.0% | 43.1% |
| Mean | 49.3% | 40.7% |
| Median | 47.0% | 41.0% |
| Interquartile 25% (IQ1) | 43.3% | 34.1% |
| Interquartile 75% (IQ3) | 58.0% | 47.2% |
| Interquartile Range (IQR) | 14.7% | 13.1% |
| Standard Deviation (Sample) | 9.7% | 9.6% |
| Standard Deviation (Population) | 9.6% | 9.5% |
Similar Demographics by College, 1 year or more
Demographics Similar to Shoshone by College, 1 year or more
In terms of college, 1 year or more, the demographic groups most similar to Shoshone are Ecuadorian (54.3%, a difference of 0.040%), American (54.4%, a difference of 0.080%), Belizean (54.4%, a difference of 0.11%), Immigrants from Grenada (54.4%, a difference of 0.15%), and Comanche (54.4%, a difference of 0.18%).
| Demographics | Rating | Rank | College, 1 year or more |
| Bangladeshis | 0.2 /100 | #269 | Tragic 54.5% |
| Crow | 0.2 /100 | #270 | Tragic 54.5% |
| Bahamians | 0.2 /100 | #271 | Tragic 54.5% |
| Comanche | 0.2 /100 | #272 | Tragic 54.4% |
| Immigrants | Grenada | 0.2 /100 | #273 | Tragic 54.4% |
| Belizeans | 0.2 /100 | #274 | Tragic 54.4% |
| Americans | 0.2 /100 | #275 | Tragic 54.4% |
| Shoshone | 0.2 /100 | #276 | Tragic 54.3% |
| Ecuadorians | 0.2 /100 | #277 | Tragic 54.3% |
| Immigrants | Jamaica | 0.1 /100 | #278 | Tragic 54.2% |
| Arapaho | 0.1 /100 | #279 | Tragic 54.1% |
| Cheyenne | 0.1 /100 | #280 | Tragic 54.1% |
| Colville | 0.1 /100 | #281 | Tragic 54.1% |
| Guyanese | 0.1 /100 | #282 | Tragic 54.1% |
| Nicaraguans | 0.1 /100 | #283 | Tragic 53.9% |
Demographics Similar to Seminole by College, 1 year or more
In terms of college, 1 year or more, the demographic groups most similar to Seminole are Central American (52.1%, a difference of 0.10%), Creek (52.2%, a difference of 0.23%), Puerto Rican (52.2%, a difference of 0.31%), Mexican American Indian (51.9%, a difference of 0.33%), and Haitian (52.3%, a difference of 0.44%).
| Demographics | Rating | Rank | College, 1 year or more |
| Immigrants | Dominica | 0.0 /100 | #298 | Tragic 52.5% |
| Immigrants | Nicaragua | 0.0 /100 | #299 | Tragic 52.4% |
| Choctaw | 0.0 /100 | #300 | Tragic 52.3% |
| Haitians | 0.0 /100 | #301 | Tragic 52.3% |
| Puerto Ricans | 0.0 /100 | #302 | Tragic 52.2% |
| Creek | 0.0 /100 | #303 | Tragic 52.2% |
| Central Americans | 0.0 /100 | #304 | Tragic 52.1% |
| Seminole | 0.0 /100 | #305 | Tragic 52.1% |
| Mexican American Indians | 0.0 /100 | #306 | Tragic 51.9% |
| Immigrants | Portugal | 0.0 /100 | #307 | Tragic 51.9% |
| Salvadorans | 0.0 /100 | #308 | Tragic 51.8% |
| Apache | 0.0 /100 | #309 | Tragic 51.8% |
| Hondurans | 0.0 /100 | #310 | Tragic 51.6% |
| Immigrants | Haiti | 0.0 /100 | #311 | Tragic 51.5% |
| Pueblo | 0.0 /100 | #312 | Tragic 51.5% |