Shoshone vs Immigrants from Belarus College, 1 year or more
COMPARE
Shoshone
Immigrants from Belarus
College, 1 year or more
College, 1 year or more Comparison
Shoshone
Immigrants from Belarus
54.3%
COLLEGE, 1 YEAR OR MORE
0.2/ 100
METRIC RATING
276th/ 347
METRIC RANK
64.1%
COLLEGE, 1 YEAR OR MORE
99.7/ 100
METRIC RATING
55th/ 347
METRIC RANK
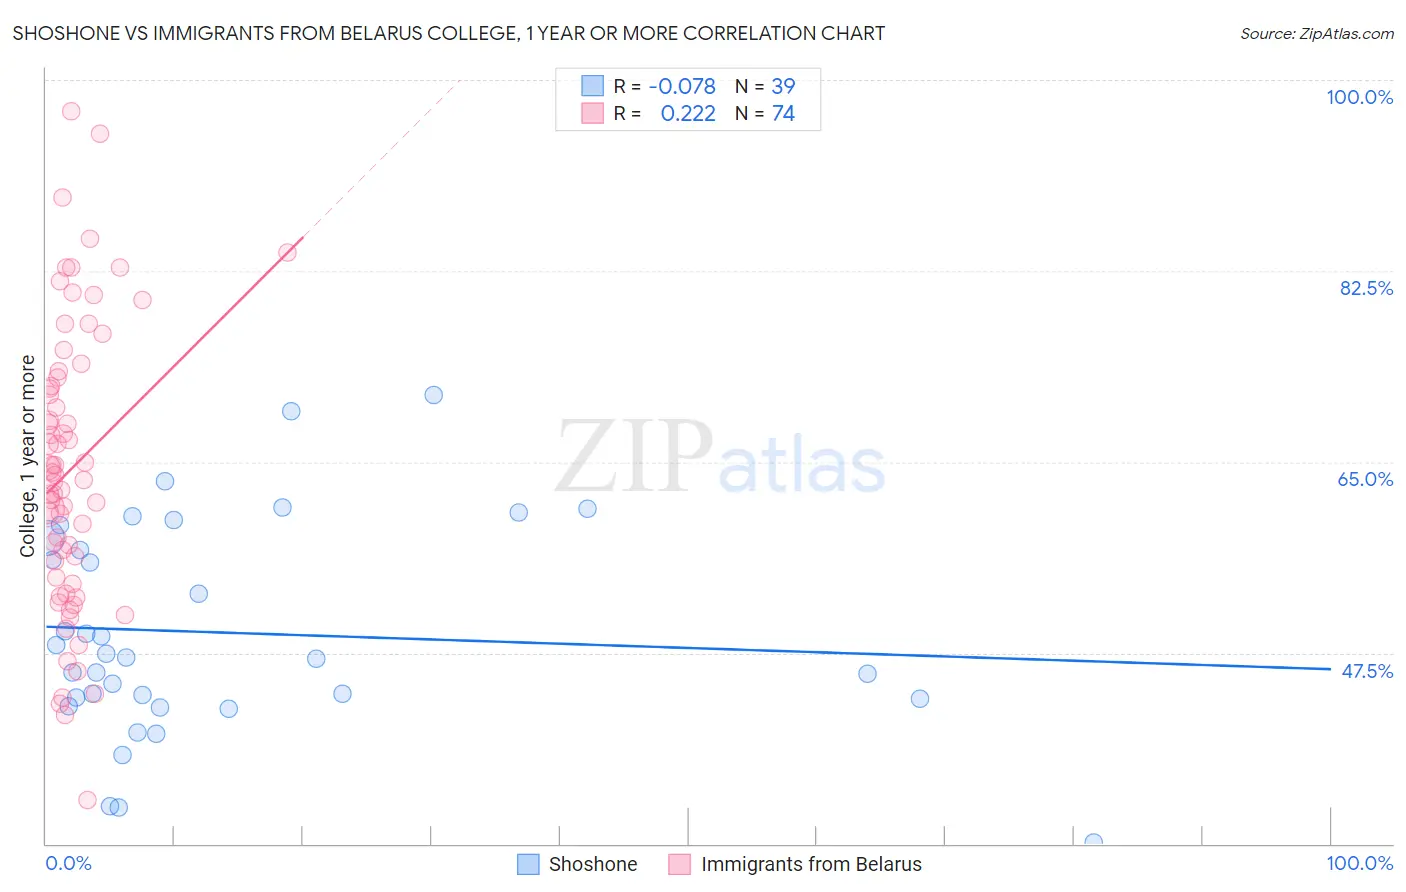
Shoshone vs Immigrants from Belarus College, 1 year or more Correlation Chart
The statistical analysis conducted on geographies consisting of 66,627,303 people shows a slight negative correlation between the proportion of Shoshone and percentage of population with at least college, 1 year or more education in the United States with a correlation coefficient (R) of -0.078 and weighted average of 54.3%. Similarly, the statistical analysis conducted on geographies consisting of 150,205,158 people shows a weak positive correlation between the proportion of Immigrants from Belarus and percentage of population with at least college, 1 year or more education in the United States with a correlation coefficient (R) of 0.222 and weighted average of 64.1%, a difference of 18.0%.
College, 1 year or more Correlation Summary
| Measurement | Shoshone | Immigrants from Belarus |
| Minimum | 30.1% | 34.0% |
| Maximum | 71.1% | 97.2% |
| Range | 41.0% | 63.1% |
| Mean | 49.3% | 64.3% |
| Median | 47.0% | 63.6% |
| Interquartile 25% (IQ1) | 43.3% | 54.4% |
| Interquartile 75% (IQ3) | 58.0% | 72.8% |
| Interquartile Range (IQR) | 14.7% | 18.4% |
| Standard Deviation (Sample) | 9.7% | 13.1% |
| Standard Deviation (Population) | 9.6% | 13.0% |
Similar Demographics by College, 1 year or more
Demographics Similar to Shoshone by College, 1 year or more
In terms of college, 1 year or more, the demographic groups most similar to Shoshone are Ecuadorian (54.3%, a difference of 0.040%), American (54.4%, a difference of 0.080%), Belizean (54.4%, a difference of 0.11%), Immigrants from Grenada (54.4%, a difference of 0.15%), and Comanche (54.4%, a difference of 0.18%).
| Demographics | Rating | Rank | College, 1 year or more |
| Bangladeshis | 0.2 /100 | #269 | Tragic 54.5% |
| Crow | 0.2 /100 | #270 | Tragic 54.5% |
| Bahamians | 0.2 /100 | #271 | Tragic 54.5% |
| Comanche | 0.2 /100 | #272 | Tragic 54.4% |
| Immigrants | Grenada | 0.2 /100 | #273 | Tragic 54.4% |
| Belizeans | 0.2 /100 | #274 | Tragic 54.4% |
| Americans | 0.2 /100 | #275 | Tragic 54.4% |
| Shoshone | 0.2 /100 | #276 | Tragic 54.3% |
| Ecuadorians | 0.2 /100 | #277 | Tragic 54.3% |
| Immigrants | Jamaica | 0.1 /100 | #278 | Tragic 54.2% |
| Arapaho | 0.1 /100 | #279 | Tragic 54.1% |
| Cheyenne | 0.1 /100 | #280 | Tragic 54.1% |
| Colville | 0.1 /100 | #281 | Tragic 54.1% |
| Guyanese | 0.1 /100 | #282 | Tragic 54.1% |
| Nicaraguans | 0.1 /100 | #283 | Tragic 53.9% |
Demographics Similar to Immigrants from Belarus by College, 1 year or more
In terms of college, 1 year or more, the demographic groups most similar to Immigrants from Belarus are Immigrants from Czechoslovakia (64.1%, a difference of 0.030%), South African (64.1%, a difference of 0.040%), Zimbabwean (64.2%, a difference of 0.12%), Asian (64.2%, a difference of 0.15%), and Immigrants from Netherlands (64.2%, a difference of 0.17%).
| Demographics | Rating | Rank | College, 1 year or more |
| Immigrants | Bulgaria | 99.9 /100 | #48 | Exceptional 64.6% |
| New Zealanders | 99.9 /100 | #49 | Exceptional 64.6% |
| Immigrants | Austria | 99.8 /100 | #50 | Exceptional 64.4% |
| Immigrants | Malaysia | 99.8 /100 | #51 | Exceptional 64.3% |
| Immigrants | Netherlands | 99.8 /100 | #52 | Exceptional 64.2% |
| Asians | 99.8 /100 | #53 | Exceptional 64.2% |
| Zimbabweans | 99.8 /100 | #54 | Exceptional 64.2% |
| Immigrants | Belarus | 99.7 /100 | #55 | Exceptional 64.1% |
| Immigrants | Czechoslovakia | 99.7 /100 | #56 | Exceptional 64.1% |
| South Africans | 99.7 /100 | #57 | Exceptional 64.1% |
| Immigrants | Asia | 99.7 /100 | #58 | Exceptional 64.0% |
| Immigrants | Serbia | 99.6 /100 | #59 | Exceptional 63.8% |
| Immigrants | Kazakhstan | 99.5 /100 | #60 | Exceptional 63.6% |
| Bolivians | 99.5 /100 | #61 | Exceptional 63.5% |
| Immigrants | Indonesia | 99.5 /100 | #62 | Exceptional 63.5% |