Serbian vs British West Indian College, Under 1 year
COMPARE
Serbian
British West Indian
College, Under 1 year
College, Under 1 year Comparison
Serbians
British West Indians
67.4%
COLLEGE, UNDER 1 YEAR
93.9/ 100
METRIC RATING
120th/ 347
METRIC RANK
59.5%
COLLEGE, UNDER 1 YEAR
0.0/ 100
METRIC RATING
286th/ 347
METRIC RANK
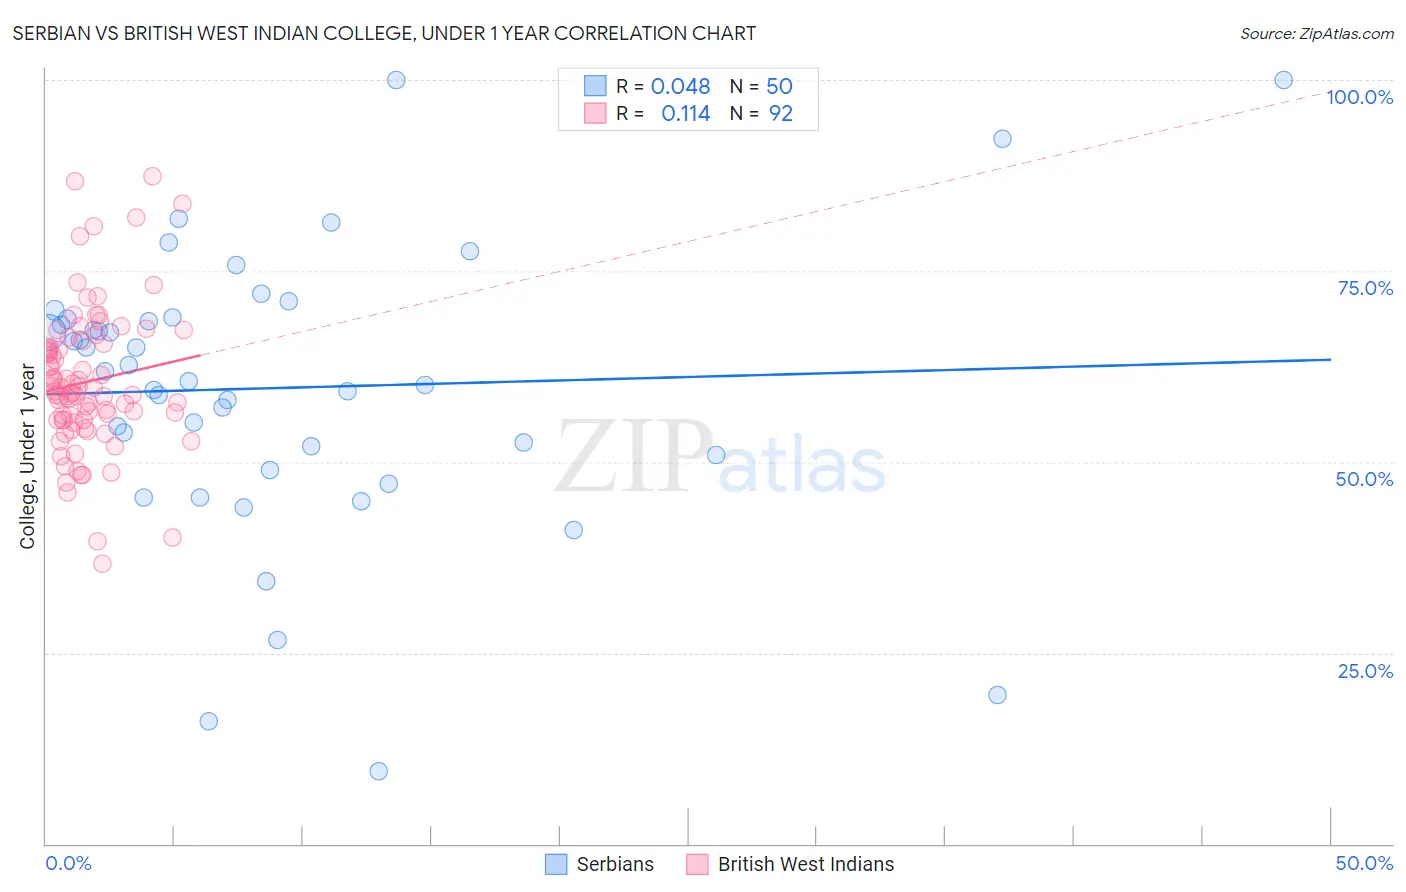
Serbian vs British West Indian College, Under 1 year Correlation Chart
The statistical analysis conducted on geographies consisting of 267,640,905 people shows no correlation between the proportion of Serbians and percentage of population with at least college, under 1 year education in the United States with a correlation coefficient (R) of 0.048 and weighted average of 67.4%. Similarly, the statistical analysis conducted on geographies consisting of 152,695,779 people shows a poor positive correlation between the proportion of British West Indians and percentage of population with at least college, under 1 year education in the United States with a correlation coefficient (R) of 0.114 and weighted average of 59.5%, a difference of 13.2%.
College, Under 1 year Correlation Summary
| Measurement | Serbian | British West Indian |
| Minimum | 9.5% | 36.6% |
| Maximum | 100.0% | 87.5% |
| Range | 90.5% | 50.8% |
| Mean | 59.7% | 60.5% |
| Median | 61.2% | 59.2% |
| Interquartile 25% (IQ1) | 50.9% | 55.5% |
| Interquartile 75% (IQ3) | 68.7% | 65.3% |
| Interquartile Range (IQR) | 17.7% | 9.8% |
| Standard Deviation (Sample) | 18.5% | 9.4% |
| Standard Deviation (Population) | 18.3% | 9.3% |
Similar Demographics by College, Under 1 year
Demographics Similar to Serbians by College, Under 1 year
In terms of college, under 1 year, the demographic groups most similar to Serbians are Slovene (67.3%, a difference of 0.10%), Lebanese (67.5%, a difference of 0.15%), Immigrants from Ukraine (67.5%, a difference of 0.16%), Pakistani (67.5%, a difference of 0.18%), and Immigrants from Jordan (67.3%, a difference of 0.18%).
| Demographics | Rating | Rank | College, Under 1 year |
| Syrians | 95.6 /100 | #113 | Exceptional 67.6% |
| Chileans | 95.3 /100 | #114 | Exceptional 67.6% |
| Basques | 95.2 /100 | #115 | Exceptional 67.6% |
| Immigrants | Nepal | 94.9 /100 | #116 | Exceptional 67.5% |
| Pakistanis | 94.8 /100 | #117 | Exceptional 67.5% |
| Immigrants | Ukraine | 94.7 /100 | #118 | Exceptional 67.5% |
| Lebanese | 94.6 /100 | #119 | Exceptional 67.5% |
| Serbians | 93.9 /100 | #120 | Exceptional 67.4% |
| Slovenes | 93.3 /100 | #121 | Exceptional 67.3% |
| Immigrants | Jordan | 92.8 /100 | #122 | Exceptional 67.3% |
| Immigrants | Northern Africa | 92.7 /100 | #123 | Exceptional 67.2% |
| Arabs | 92.6 /100 | #124 | Exceptional 67.2% |
| Italians | 91.8 /100 | #125 | Exceptional 67.2% |
| Alsatians | 91.3 /100 | #126 | Exceptional 67.1% |
| Czechs | 90.8 /100 | #127 | Exceptional 67.1% |
Demographics Similar to British West Indians by College, Under 1 year
In terms of college, under 1 year, the demographic groups most similar to British West Indians are Paiute (59.6%, a difference of 0.14%), Immigrants from St. Vincent and the Grenadines (59.6%, a difference of 0.15%), Sioux (59.4%, a difference of 0.17%), Immigrants from Jamaica (59.7%, a difference of 0.27%), and Black/African American (59.4%, a difference of 0.27%).
| Demographics | Rating | Rank | College, Under 1 year |
| Ute | 0.1 /100 | #279 | Tragic 60.2% |
| Crow | 0.1 /100 | #280 | Tragic 60.2% |
| Cherokee | 0.1 /100 | #281 | Tragic 60.1% |
| Belizeans | 0.1 /100 | #282 | Tragic 60.1% |
| Immigrants | Jamaica | 0.0 /100 | #283 | Tragic 59.7% |
| Immigrants | St. Vincent and the Grenadines | 0.0 /100 | #284 | Tragic 59.6% |
| Paiute | 0.0 /100 | #285 | Tragic 59.6% |
| British West Indians | 0.0 /100 | #286 | Tragic 59.5% |
| Sioux | 0.0 /100 | #287 | Tragic 59.4% |
| Blacks/African Americans | 0.0 /100 | #288 | Tragic 59.4% |
| Choctaw | 0.0 /100 | #289 | Tragic 59.3% |
| Ecuadorians | 0.0 /100 | #290 | Tragic 59.3% |
| Creek | 0.0 /100 | #291 | Tragic 59.3% |
| Nicaraguans | 0.0 /100 | #292 | Tragic 59.2% |
| Seminole | 0.0 /100 | #293 | Tragic 59.1% |