Serbian vs Subsaharan African College, Under 1 year
COMPARE
Serbian
Subsaharan African
College, Under 1 year
College, Under 1 year Comparison
Serbians
Sub-Saharan Africans
67.4%
COLLEGE, UNDER 1 YEAR
93.9/ 100
METRIC RATING
120th/ 347
METRIC RANK
63.2%
COLLEGE, UNDER 1 YEAR
4.4/ 100
METRIC RATING
224th/ 347
METRIC RANK
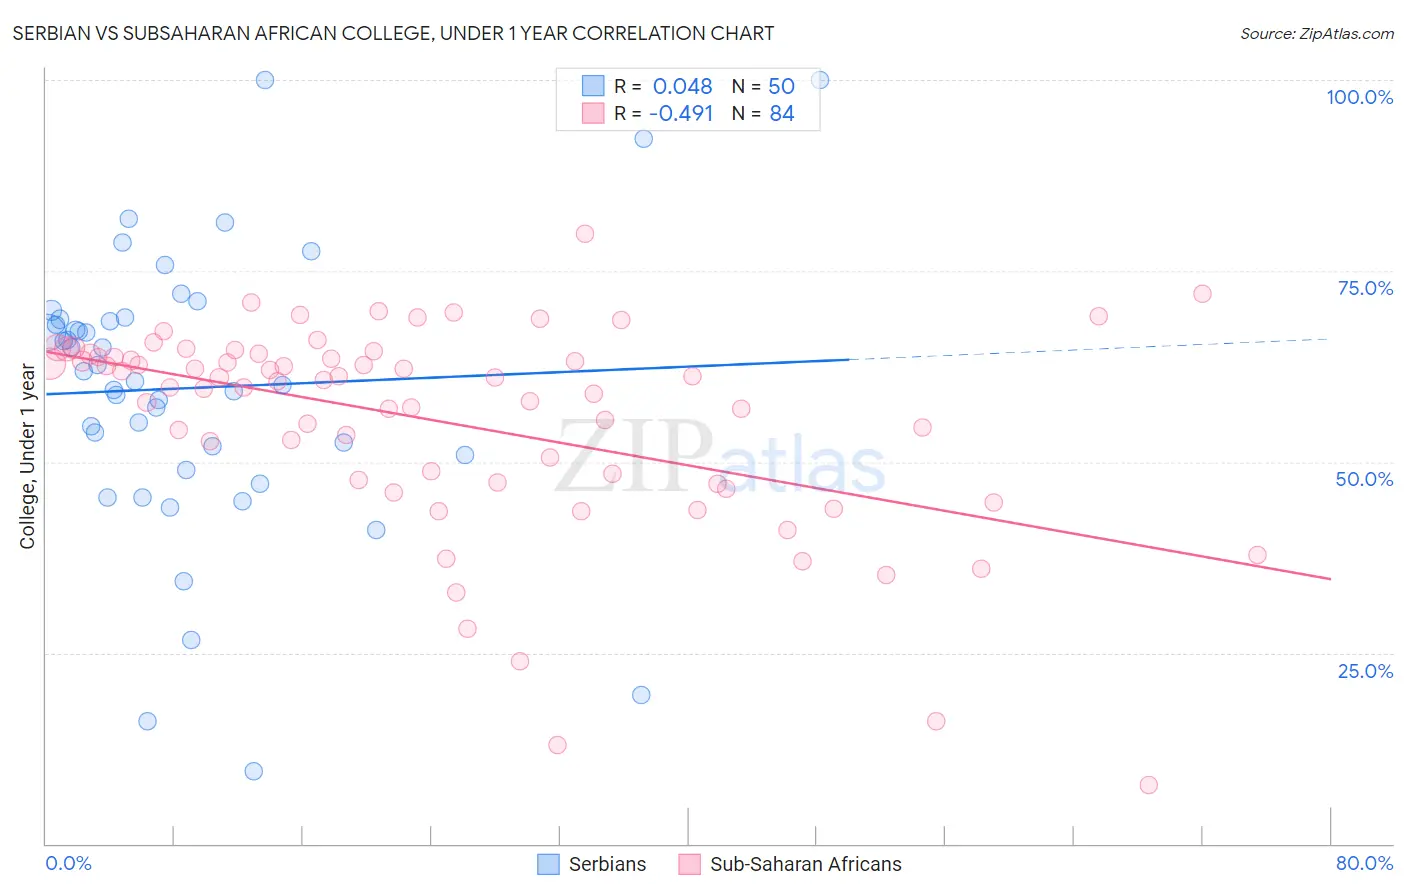
Serbian vs Subsaharan African College, Under 1 year Correlation Chart
The statistical analysis conducted on geographies consisting of 267,640,905 people shows no correlation between the proportion of Serbians and percentage of population with at least college, under 1 year education in the United States with a correlation coefficient (R) of 0.048 and weighted average of 67.4%. Similarly, the statistical analysis conducted on geographies consisting of 508,213,731 people shows a moderate negative correlation between the proportion of Sub-Saharan Africans and percentage of population with at least college, under 1 year education in the United States with a correlation coefficient (R) of -0.491 and weighted average of 63.2%, a difference of 6.6%.
College, Under 1 year Correlation Summary
| Measurement | Serbian | Subsaharan African |
| Minimum | 9.5% | 7.7% |
| Maximum | 100.0% | 79.8% |
| Range | 90.5% | 72.1% |
| Mean | 59.7% | 55.3% |
| Median | 61.2% | 60.7% |
| Interquartile 25% (IQ1) | 50.9% | 47.4% |
| Interquartile 75% (IQ3) | 68.7% | 63.9% |
| Interquartile Range (IQR) | 17.7% | 16.5% |
| Standard Deviation (Sample) | 18.5% | 13.7% |
| Standard Deviation (Population) | 18.3% | 13.6% |
Similar Demographics by College, Under 1 year
Demographics Similar to Serbians by College, Under 1 year
In terms of college, under 1 year, the demographic groups most similar to Serbians are Slovene (67.3%, a difference of 0.10%), Lebanese (67.5%, a difference of 0.15%), Immigrants from Ukraine (67.5%, a difference of 0.16%), Pakistani (67.5%, a difference of 0.18%), and Immigrants from Jordan (67.3%, a difference of 0.18%).
| Demographics | Rating | Rank | College, Under 1 year |
| Syrians | 95.6 /100 | #113 | Exceptional 67.6% |
| Chileans | 95.3 /100 | #114 | Exceptional 67.6% |
| Basques | 95.2 /100 | #115 | Exceptional 67.6% |
| Immigrants | Nepal | 94.9 /100 | #116 | Exceptional 67.5% |
| Pakistanis | 94.8 /100 | #117 | Exceptional 67.5% |
| Immigrants | Ukraine | 94.7 /100 | #118 | Exceptional 67.5% |
| Lebanese | 94.6 /100 | #119 | Exceptional 67.5% |
| Serbians | 93.9 /100 | #120 | Exceptional 67.4% |
| Slovenes | 93.3 /100 | #121 | Exceptional 67.3% |
| Immigrants | Jordan | 92.8 /100 | #122 | Exceptional 67.3% |
| Immigrants | Northern Africa | 92.7 /100 | #123 | Exceptional 67.2% |
| Arabs | 92.6 /100 | #124 | Exceptional 67.2% |
| Italians | 91.8 /100 | #125 | Exceptional 67.2% |
| Alsatians | 91.3 /100 | #126 | Exceptional 67.1% |
| Czechs | 90.8 /100 | #127 | Exceptional 67.1% |
Demographics Similar to Sub-Saharan Africans by College, Under 1 year
In terms of college, under 1 year, the demographic groups most similar to Sub-Saharan Africans are Immigrants from Costa Rica (63.2%, a difference of 0.030%), Immigrants from Peru (63.1%, a difference of 0.10%), Immigrants from Colombia (63.1%, a difference of 0.12%), Immigrants from Senegal (63.3%, a difference of 0.15%), and Cree (63.3%, a difference of 0.20%).
| Demographics | Rating | Rank | College, Under 1 year |
| Immigrants | Uruguay | 5.8 /100 | #217 | Tragic 63.4% |
| Immigrants | Panama | 5.7 /100 | #218 | Tragic 63.4% |
| Immigrants | Fiji | 5.7 /100 | #219 | Tragic 63.4% |
| Portuguese | 5.6 /100 | #220 | Tragic 63.4% |
| Cree | 5.2 /100 | #221 | Tragic 63.3% |
| Immigrants | Senegal | 5.0 /100 | #222 | Tragic 63.3% |
| Immigrants | Costa Rica | 4.5 /100 | #223 | Tragic 63.2% |
| Sub-Saharan Africans | 4.4 /100 | #224 | Tragic 63.2% |
| Immigrants | Peru | 4.0 /100 | #225 | Tragic 63.1% |
| Immigrants | Colombia | 4.0 /100 | #226 | Tragic 63.1% |
| Immigrants | Ghana | 3.7 /100 | #227 | Tragic 63.1% |
| Samoans | 3.3 /100 | #228 | Tragic 63.0% |
| Liberians | 3.2 /100 | #229 | Tragic 63.0% |
| Immigrants | Nonimmigrants | 3.0 /100 | #230 | Tragic 62.9% |
| Immigrants | Western Africa | 2.4 /100 | #231 | Tragic 62.8% |