Irish vs British West Indian College, Under 1 year
COMPARE
Irish
British West Indian
College, Under 1 year
College, Under 1 year Comparison
Irish
British West Indians
66.0%
COLLEGE, UNDER 1 YEAR
70.3/ 100
METRIC RATING
155th/ 347
METRIC RANK
59.5%
COLLEGE, UNDER 1 YEAR
0.0/ 100
METRIC RATING
286th/ 347
METRIC RANK
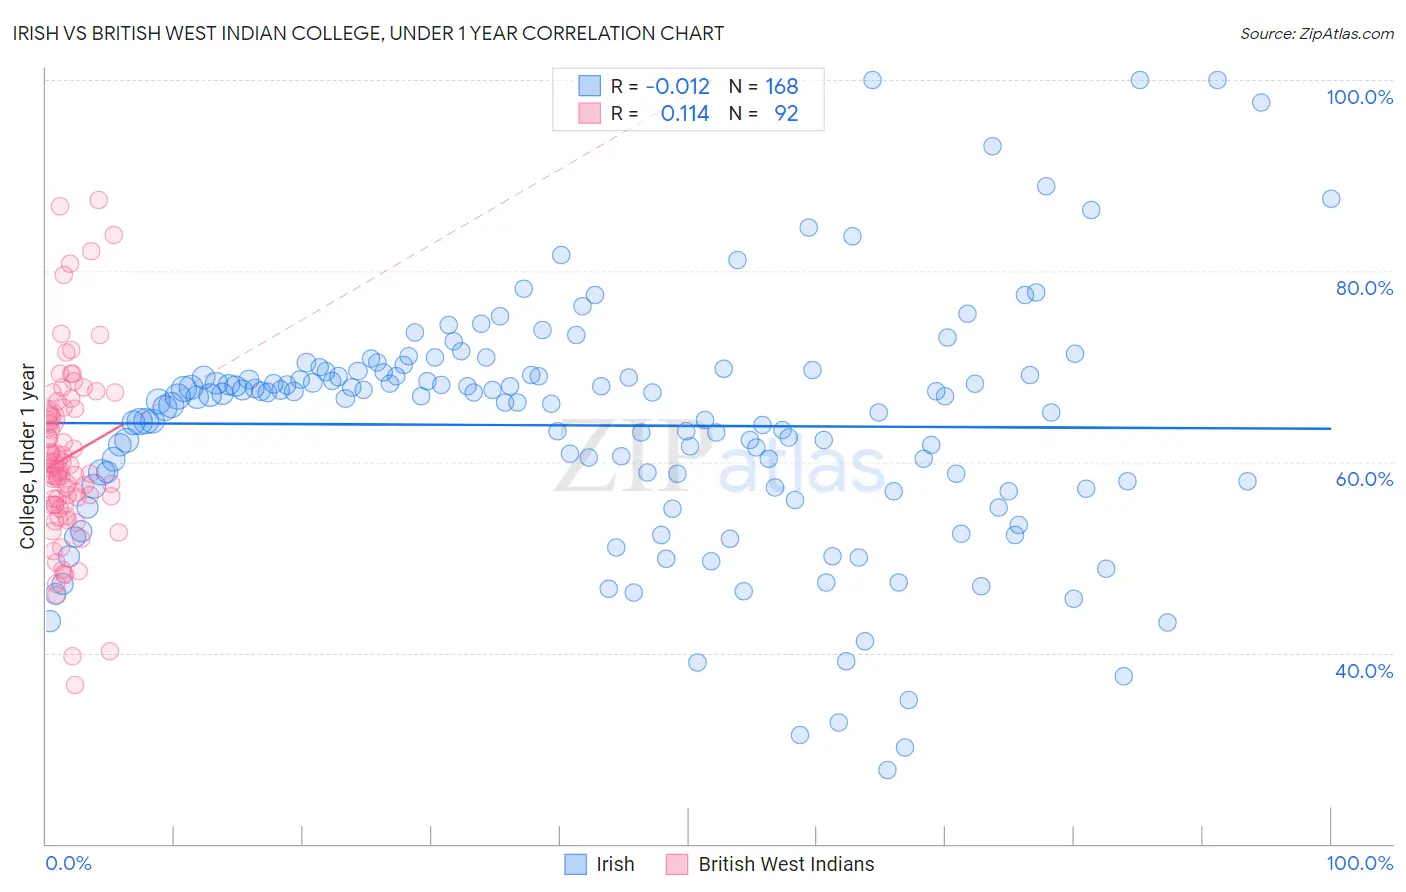
Irish vs British West Indian College, Under 1 year Correlation Chart
The statistical analysis conducted on geographies consisting of 580,693,587 people shows no correlation between the proportion of Irish and percentage of population with at least college, under 1 year education in the United States with a correlation coefficient (R) of -0.012 and weighted average of 66.0%. Similarly, the statistical analysis conducted on geographies consisting of 152,695,779 people shows a poor positive correlation between the proportion of British West Indians and percentage of population with at least college, under 1 year education in the United States with a correlation coefficient (R) of 0.114 and weighted average of 59.5%, a difference of 10.9%.
College, Under 1 year Correlation Summary
| Measurement | Irish | British West Indian |
| Minimum | 27.7% | 36.6% |
| Maximum | 100.0% | 87.5% |
| Range | 72.3% | 50.8% |
| Mean | 63.8% | 60.5% |
| Median | 66.7% | 59.2% |
| Interquartile 25% (IQ1) | 57.4% | 55.5% |
| Interquartile 75% (IQ3) | 69.1% | 65.3% |
| Interquartile Range (IQR) | 11.7% | 9.8% |
| Standard Deviation (Sample) | 12.6% | 9.4% |
| Standard Deviation (Population) | 12.6% | 9.3% |
Similar Demographics by College, Under 1 year
Demographics Similar to Irish by College, Under 1 year
In terms of college, under 1 year, the demographic groups most similar to Irish are Welsh (66.0%, a difference of 0.020%), Immigrants from Eritrea (66.1%, a difference of 0.090%), Sierra Leonean (66.0%, a difference of 0.12%), Celtic (65.9%, a difference of 0.15%), and Belgian (66.2%, a difference of 0.18%).
| Demographics | Rating | Rank | College, Under 1 year |
| Taiwanese | 78.6 /100 | #148 | Good 66.4% |
| Immigrants | Venezuela | 77.9 /100 | #149 | Good 66.3% |
| Immigrants | Iraq | 77.1 /100 | #150 | Good 66.3% |
| Immigrants | Sudan | 76.0 /100 | #151 | Good 66.2% |
| Sudanese | 74.1 /100 | #152 | Good 66.2% |
| Belgians | 73.7 /100 | #153 | Good 66.2% |
| Immigrants | Eritrea | 71.9 /100 | #154 | Good 66.1% |
| Irish | 70.3 /100 | #155 | Good 66.0% |
| Welsh | 69.9 /100 | #156 | Good 66.0% |
| Sierra Leoneans | 67.8 /100 | #157 | Good 66.0% |
| Celtics | 67.3 /100 | #158 | Good 65.9% |
| Tlingit-Haida | 66.4 /100 | #159 | Good 65.9% |
| Albanians | 66.1 /100 | #160 | Good 65.9% |
| Brazilians | 66.0 /100 | #161 | Good 65.9% |
| Koreans | 65.3 /100 | #162 | Good 65.9% |
Demographics Similar to British West Indians by College, Under 1 year
In terms of college, under 1 year, the demographic groups most similar to British West Indians are Paiute (59.6%, a difference of 0.14%), Immigrants from St. Vincent and the Grenadines (59.6%, a difference of 0.15%), Sioux (59.4%, a difference of 0.17%), Immigrants from Jamaica (59.7%, a difference of 0.27%), and Black/African American (59.4%, a difference of 0.27%).
| Demographics | Rating | Rank | College, Under 1 year |
| Ute | 0.1 /100 | #279 | Tragic 60.2% |
| Crow | 0.1 /100 | #280 | Tragic 60.2% |
| Cherokee | 0.1 /100 | #281 | Tragic 60.1% |
| Belizeans | 0.1 /100 | #282 | Tragic 60.1% |
| Immigrants | Jamaica | 0.0 /100 | #283 | Tragic 59.7% |
| Immigrants | St. Vincent and the Grenadines | 0.0 /100 | #284 | Tragic 59.6% |
| Paiute | 0.0 /100 | #285 | Tragic 59.6% |
| British West Indians | 0.0 /100 | #286 | Tragic 59.5% |
| Sioux | 0.0 /100 | #287 | Tragic 59.4% |
| Blacks/African Americans | 0.0 /100 | #288 | Tragic 59.4% |
| Choctaw | 0.0 /100 | #289 | Tragic 59.3% |
| Ecuadorians | 0.0 /100 | #290 | Tragic 59.3% |
| Creek | 0.0 /100 | #291 | Tragic 59.3% |
| Nicaraguans | 0.0 /100 | #292 | Tragic 59.2% |
| Seminole | 0.0 /100 | #293 | Tragic 59.1% |