Serbian vs Hispanic or Latino College, Under 1 year
COMPARE
Serbian
Hispanic or Latino
College, Under 1 year
College, Under 1 year Comparison
Serbians
Hispanics or Latinos
67.4%
COLLEGE, UNDER 1 YEAR
93.9/ 100
METRIC RATING
120th/ 347
METRIC RANK
57.0%
COLLEGE, UNDER 1 YEAR
0.0/ 100
METRIC RATING
317th/ 347
METRIC RANK
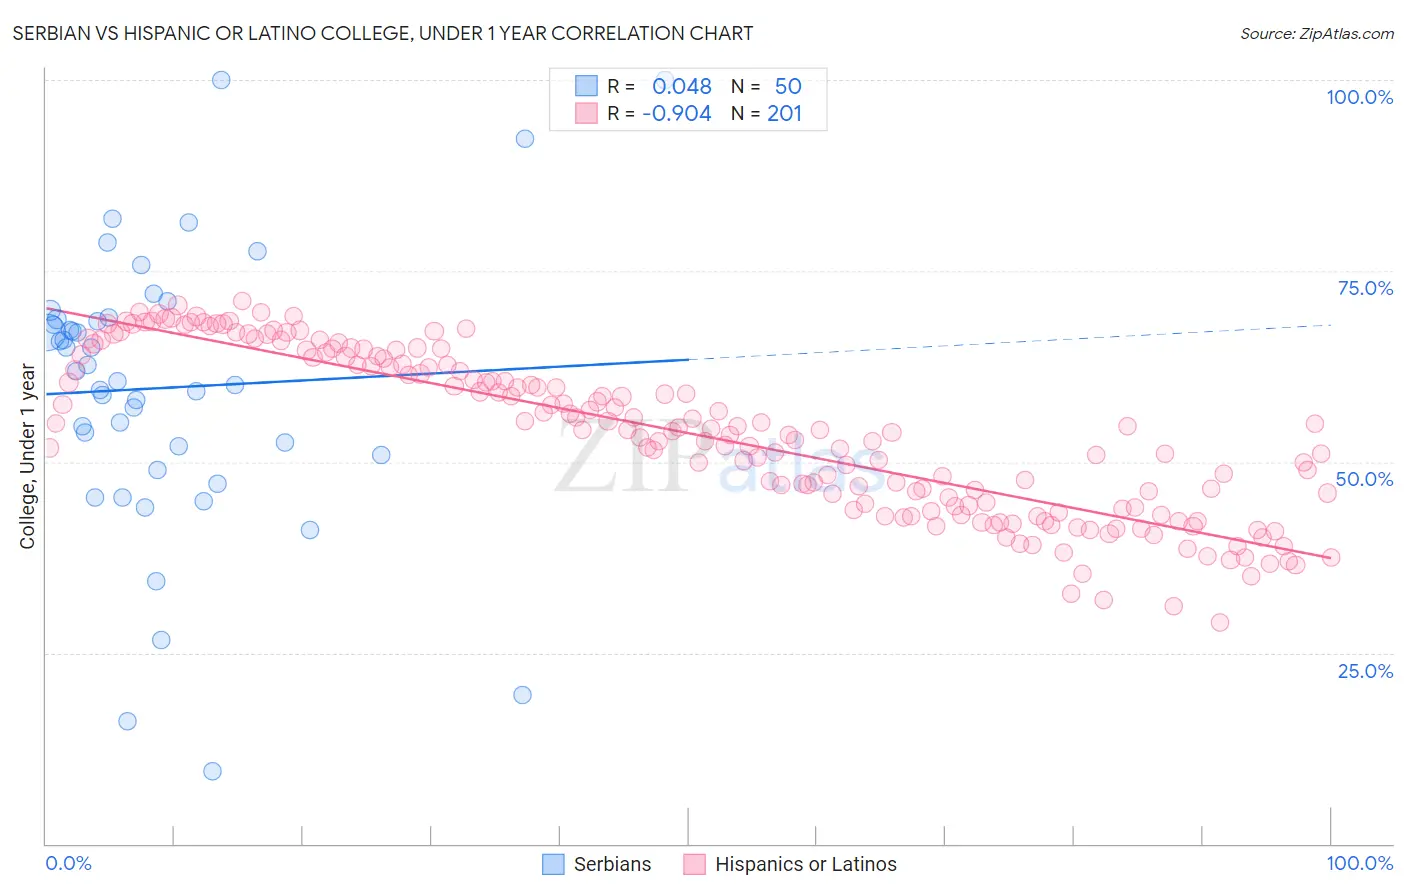
Serbian vs Hispanic or Latino College, Under 1 year Correlation Chart
The statistical analysis conducted on geographies consisting of 267,640,905 people shows no correlation between the proportion of Serbians and percentage of population with at least college, under 1 year education in the United States with a correlation coefficient (R) of 0.048 and weighted average of 67.4%. Similarly, the statistical analysis conducted on geographies consisting of 578,595,027 people shows a near-perfect negative correlation between the proportion of Hispanics or Latinos and percentage of population with at least college, under 1 year education in the United States with a correlation coefficient (R) of -0.904 and weighted average of 57.0%, a difference of 18.2%.
College, Under 1 year Correlation Summary
| Measurement | Serbian | Hispanic or Latino |
| Minimum | 9.5% | 29.0% |
| Maximum | 100.0% | 71.0% |
| Range | 90.5% | 42.1% |
| Mean | 59.7% | 53.7% |
| Median | 61.2% | 54.2% |
| Interquartile 25% (IQ1) | 50.9% | 44.1% |
| Interquartile 75% (IQ3) | 68.7% | 63.6% |
| Interquartile Range (IQR) | 17.7% | 19.5% |
| Standard Deviation (Sample) | 18.5% | 10.5% |
| Standard Deviation (Population) | 18.3% | 10.5% |
Similar Demographics by College, Under 1 year
Demographics Similar to Serbians by College, Under 1 year
In terms of college, under 1 year, the demographic groups most similar to Serbians are Slovene (67.3%, a difference of 0.10%), Lebanese (67.5%, a difference of 0.15%), Immigrants from Ukraine (67.5%, a difference of 0.16%), Pakistani (67.5%, a difference of 0.18%), and Immigrants from Jordan (67.3%, a difference of 0.18%).
| Demographics | Rating | Rank | College, Under 1 year |
| Syrians | 95.6 /100 | #113 | Exceptional 67.6% |
| Chileans | 95.3 /100 | #114 | Exceptional 67.6% |
| Basques | 95.2 /100 | #115 | Exceptional 67.6% |
| Immigrants | Nepal | 94.9 /100 | #116 | Exceptional 67.5% |
| Pakistanis | 94.8 /100 | #117 | Exceptional 67.5% |
| Immigrants | Ukraine | 94.7 /100 | #118 | Exceptional 67.5% |
| Lebanese | 94.6 /100 | #119 | Exceptional 67.5% |
| Serbians | 93.9 /100 | #120 | Exceptional 67.4% |
| Slovenes | 93.3 /100 | #121 | Exceptional 67.3% |
| Immigrants | Jordan | 92.8 /100 | #122 | Exceptional 67.3% |
| Immigrants | Northern Africa | 92.7 /100 | #123 | Exceptional 67.2% |
| Arabs | 92.6 /100 | #124 | Exceptional 67.2% |
| Italians | 91.8 /100 | #125 | Exceptional 67.2% |
| Alsatians | 91.3 /100 | #126 | Exceptional 67.1% |
| Czechs | 90.8 /100 | #127 | Exceptional 67.1% |
Demographics Similar to Hispanics or Latinos by College, Under 1 year
In terms of college, under 1 year, the demographic groups most similar to Hispanics or Latinos are Menominee (57.0%, a difference of 0.040%), Honduran (57.1%, a difference of 0.090%), Immigrants from Haiti (56.9%, a difference of 0.12%), Hopi (57.1%, a difference of 0.14%), and Dutch West Indian (57.2%, a difference of 0.26%).
| Demographics | Rating | Rank | College, Under 1 year |
| Pueblo | 0.0 /100 | #310 | Tragic 57.4% |
| Cajuns | 0.0 /100 | #311 | Tragic 57.3% |
| Salvadorans | 0.0 /100 | #312 | Tragic 57.3% |
| Dutch West Indians | 0.0 /100 | #313 | Tragic 57.2% |
| Hopi | 0.0 /100 | #314 | Tragic 57.1% |
| Hondurans | 0.0 /100 | #315 | Tragic 57.1% |
| Menominee | 0.0 /100 | #316 | Tragic 57.0% |
| Hispanics or Latinos | 0.0 /100 | #317 | Tragic 57.0% |
| Immigrants | Haiti | 0.0 /100 | #318 | Tragic 56.9% |
| Puerto Ricans | 0.0 /100 | #319 | Tragic 56.8% |
| Guatemalans | 0.0 /100 | #320 | Tragic 56.8% |
| Natives/Alaskans | 0.0 /100 | #321 | Tragic 56.6% |
| Immigrants | Caribbean | 0.0 /100 | #322 | Tragic 56.6% |
| Immigrants | Honduras | 0.0 /100 | #323 | Tragic 56.5% |
| Immigrants | El Salvador | 0.0 /100 | #324 | Tragic 56.4% |