Guatemalan vs British West Indian College, Under 1 year
COMPARE
Guatemalan
British West Indian
College, Under 1 year
College, Under 1 year Comparison
Guatemalans
British West Indians
56.8%
COLLEGE, UNDER 1 YEAR
0.0/ 100
METRIC RATING
320th/ 347
METRIC RANK
59.5%
COLLEGE, UNDER 1 YEAR
0.0/ 100
METRIC RATING
286th/ 347
METRIC RANK
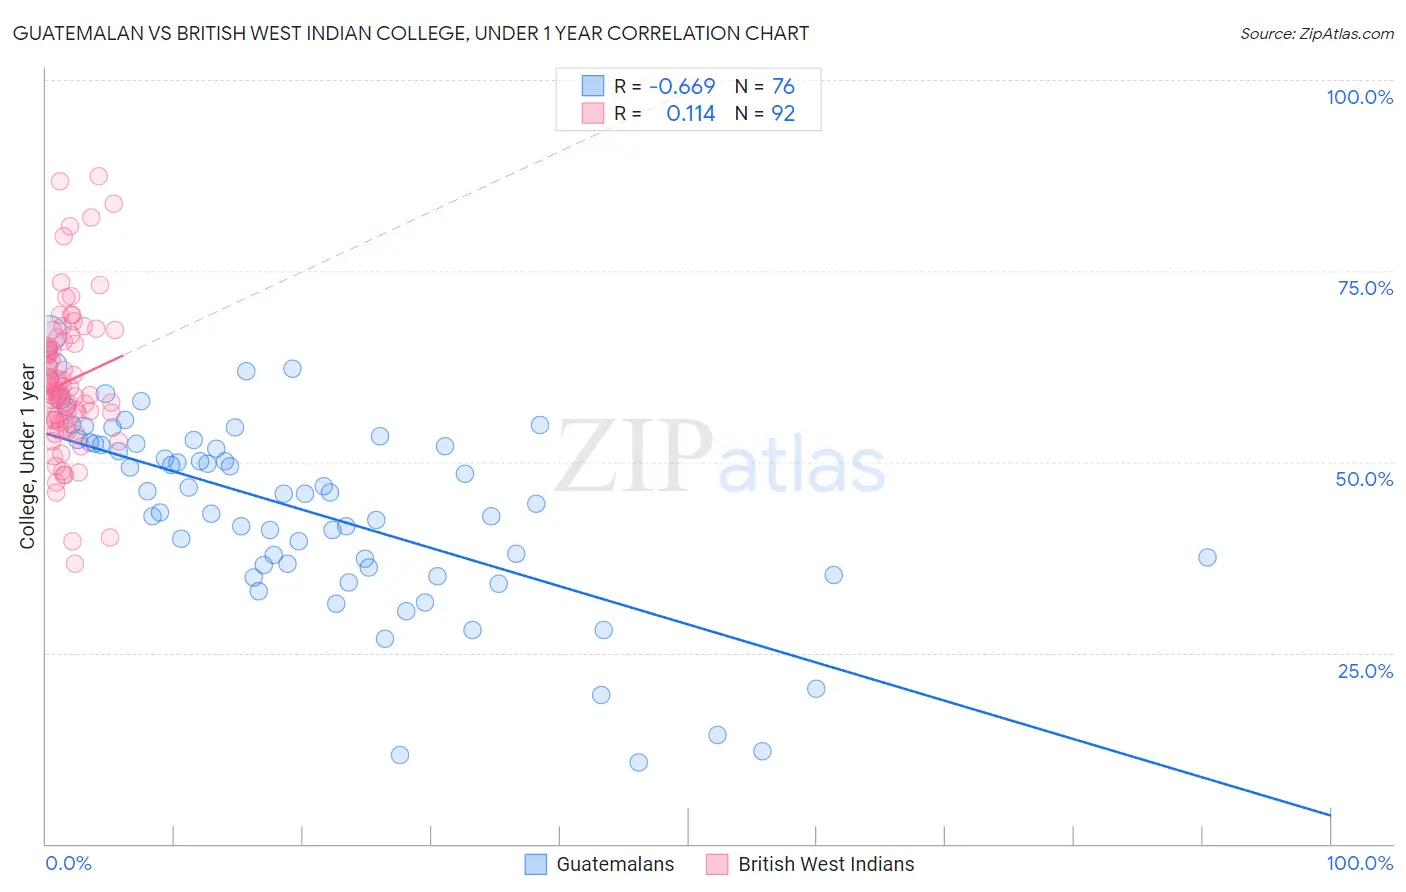
Guatemalan vs British West Indian College, Under 1 year Correlation Chart
The statistical analysis conducted on geographies consisting of 409,563,856 people shows a significant negative correlation between the proportion of Guatemalans and percentage of population with at least college, under 1 year education in the United States with a correlation coefficient (R) of -0.669 and weighted average of 56.8%. Similarly, the statistical analysis conducted on geographies consisting of 152,695,779 people shows a poor positive correlation between the proportion of British West Indians and percentage of population with at least college, under 1 year education in the United States with a correlation coefficient (R) of 0.114 and weighted average of 59.5%, a difference of 4.8%.
College, Under 1 year Correlation Summary
| Measurement | Guatemalan | British West Indian |
| Minimum | 10.7% | 36.6% |
| Maximum | 66.9% | 87.5% |
| Range | 56.2% | 50.8% |
| Mean | 43.4% | 60.5% |
| Median | 45.8% | 59.2% |
| Interquartile 25% (IQ1) | 36.4% | 55.5% |
| Interquartile 75% (IQ3) | 52.4% | 65.3% |
| Interquartile Range (IQR) | 16.0% | 9.8% |
| Standard Deviation (Sample) | 12.4% | 9.4% |
| Standard Deviation (Population) | 12.3% | 9.3% |
Similar Demographics by College, Under 1 year
Demographics Similar to Guatemalans by College, Under 1 year
In terms of college, under 1 year, the demographic groups most similar to Guatemalans are Puerto Rican (56.8%, a difference of 0.060%), Native/Alaskan (56.6%, a difference of 0.26%), Immigrants from Haiti (56.9%, a difference of 0.27%), Hispanic or Latino (57.0%, a difference of 0.38%), and Immigrants from Caribbean (56.6%, a difference of 0.39%).
| Demographics | Rating | Rank | College, Under 1 year |
| Dutch West Indians | 0.0 /100 | #313 | Tragic 57.2% |
| Hopi | 0.0 /100 | #314 | Tragic 57.1% |
| Hondurans | 0.0 /100 | #315 | Tragic 57.1% |
| Menominee | 0.0 /100 | #316 | Tragic 57.0% |
| Hispanics or Latinos | 0.0 /100 | #317 | Tragic 57.0% |
| Immigrants | Haiti | 0.0 /100 | #318 | Tragic 56.9% |
| Puerto Ricans | 0.0 /100 | #319 | Tragic 56.8% |
| Guatemalans | 0.0 /100 | #320 | Tragic 56.8% |
| Natives/Alaskans | 0.0 /100 | #321 | Tragic 56.6% |
| Immigrants | Caribbean | 0.0 /100 | #322 | Tragic 56.6% |
| Immigrants | Honduras | 0.0 /100 | #323 | Tragic 56.5% |
| Immigrants | El Salvador | 0.0 /100 | #324 | Tragic 56.4% |
| Immigrants | Latin America | 0.0 /100 | #325 | Tragic 56.3% |
| Navajo | 0.0 /100 | #326 | Tragic 56.3% |
| Immigrants | Guatemala | 0.0 /100 | #327 | Tragic 56.2% |
Demographics Similar to British West Indians by College, Under 1 year
In terms of college, under 1 year, the demographic groups most similar to British West Indians are Paiute (59.6%, a difference of 0.14%), Immigrants from St. Vincent and the Grenadines (59.6%, a difference of 0.15%), Sioux (59.4%, a difference of 0.17%), Immigrants from Jamaica (59.7%, a difference of 0.27%), and Black/African American (59.4%, a difference of 0.27%).
| Demographics | Rating | Rank | College, Under 1 year |
| Ute | 0.1 /100 | #279 | Tragic 60.2% |
| Crow | 0.1 /100 | #280 | Tragic 60.2% |
| Cherokee | 0.1 /100 | #281 | Tragic 60.1% |
| Belizeans | 0.1 /100 | #282 | Tragic 60.1% |
| Immigrants | Jamaica | 0.0 /100 | #283 | Tragic 59.7% |
| Immigrants | St. Vincent and the Grenadines | 0.0 /100 | #284 | Tragic 59.6% |
| Paiute | 0.0 /100 | #285 | Tragic 59.6% |
| British West Indians | 0.0 /100 | #286 | Tragic 59.5% |
| Sioux | 0.0 /100 | #287 | Tragic 59.4% |
| Blacks/African Americans | 0.0 /100 | #288 | Tragic 59.4% |
| Choctaw | 0.0 /100 | #289 | Tragic 59.3% |
| Ecuadorians | 0.0 /100 | #290 | Tragic 59.3% |
| Creek | 0.0 /100 | #291 | Tragic 59.3% |
| Nicaraguans | 0.0 /100 | #292 | Tragic 59.2% |
| Seminole | 0.0 /100 | #293 | Tragic 59.1% |