Immigrants from Dominica vs British West Indian College, Under 1 year
COMPARE
Immigrants from Dominica
British West Indian
College, Under 1 year
College, Under 1 year Comparison
Immigrants from Dominica
British West Indians
57.9%
COLLEGE, UNDER 1 YEAR
0.0/ 100
METRIC RATING
303rd/ 347
METRIC RANK
59.5%
COLLEGE, UNDER 1 YEAR
0.0/ 100
METRIC RATING
286th/ 347
METRIC RANK
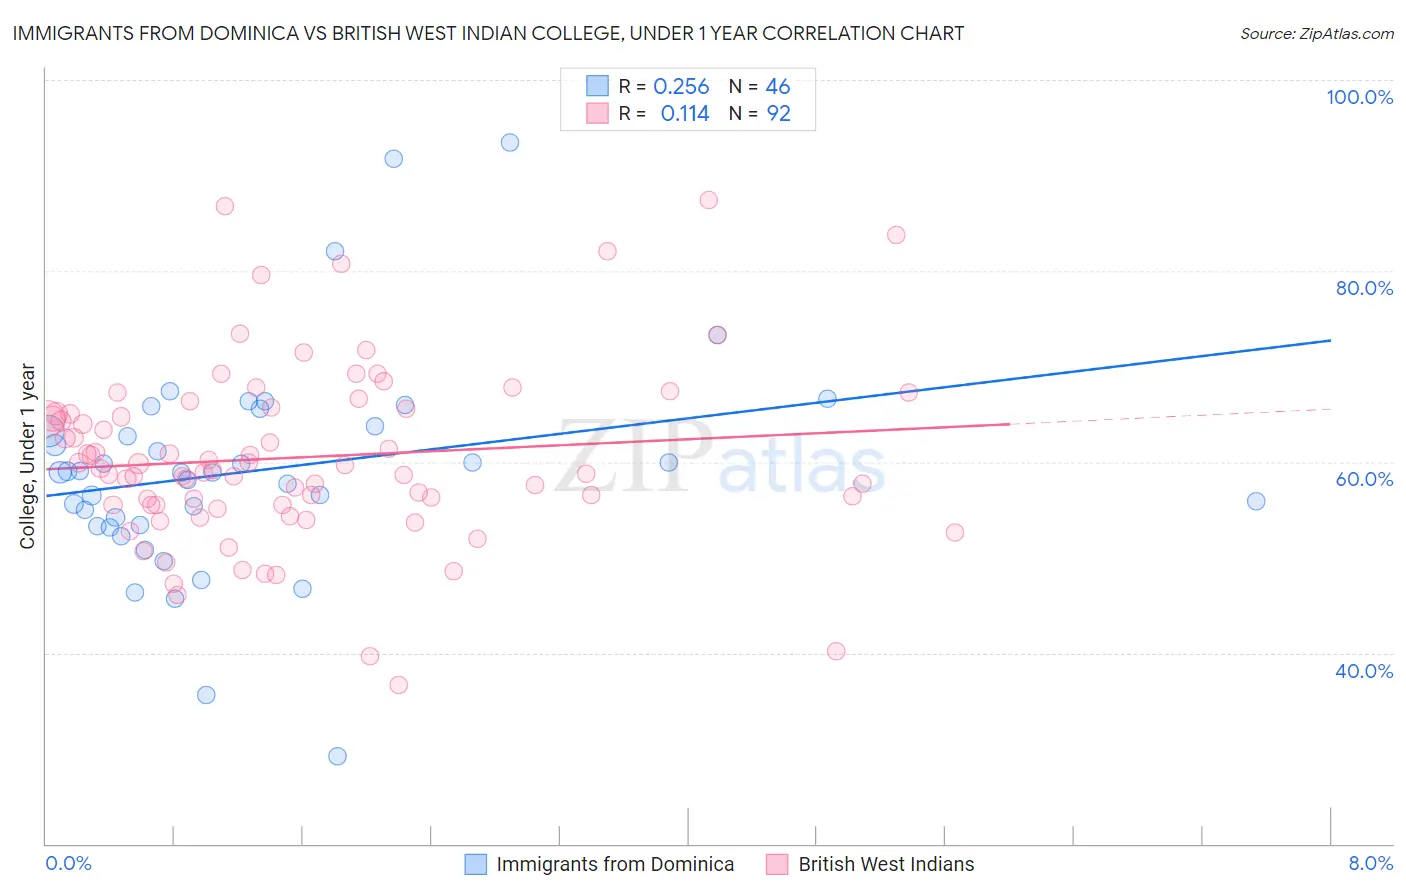
Immigrants from Dominica vs British West Indian College, Under 1 year Correlation Chart
The statistical analysis conducted on geographies consisting of 83,796,433 people shows a weak positive correlation between the proportion of Immigrants from Dominica and percentage of population with at least college, under 1 year education in the United States with a correlation coefficient (R) of 0.256 and weighted average of 57.9%. Similarly, the statistical analysis conducted on geographies consisting of 152,695,779 people shows a poor positive correlation between the proportion of British West Indians and percentage of population with at least college, under 1 year education in the United States with a correlation coefficient (R) of 0.114 and weighted average of 59.5%, a difference of 2.9%.
College, Under 1 year Correlation Summary
| Measurement | Immigrants from Dominica | British West Indian |
| Minimum | 29.1% | 36.6% |
| Maximum | 93.5% | 87.5% |
| Range | 64.4% | 50.8% |
| Mean | 59.1% | 60.5% |
| Median | 58.9% | 59.2% |
| Interquartile 25% (IQ1) | 53.3% | 55.5% |
| Interquartile 75% (IQ3) | 63.7% | 65.3% |
| Interquartile Range (IQR) | 10.4% | 9.8% |
| Standard Deviation (Sample) | 11.4% | 9.4% |
| Standard Deviation (Population) | 11.3% | 9.3% |
Demographics Similar to Immigrants from Dominica and British West Indians by College, Under 1 year
In terms of college, under 1 year, the demographic groups most similar to Immigrants from Dominica are Kiowa (57.8%, a difference of 0.010%), Apache (58.0%, a difference of 0.29%), Mexican American Indian (58.1%, a difference of 0.48%), Immigrants from Guyana (58.5%, a difference of 1.1%), and Cuban (58.6%, a difference of 1.4%). Similarly, the demographic groups most similar to British West Indians are Paiute (59.6%, a difference of 0.14%), Immigrants from St. Vincent and the Grenadines (59.6%, a difference of 0.15%), Sioux (59.4%, a difference of 0.17%), Black/African American (59.4%, a difference of 0.27%), and Choctaw (59.3%, a difference of 0.34%).
| Demographics | Rating | Rank | College, Under 1 year |
| Immigrants | St. Vincent and the Grenadines | 0.0 /100 | #284 | Tragic 59.6% |
| Paiute | 0.0 /100 | #285 | Tragic 59.6% |
| British West Indians | 0.0 /100 | #286 | Tragic 59.5% |
| Sioux | 0.0 /100 | #287 | Tragic 59.4% |
| Blacks/African Americans | 0.0 /100 | #288 | Tragic 59.4% |
| Choctaw | 0.0 /100 | #289 | Tragic 59.3% |
| Ecuadorians | 0.0 /100 | #290 | Tragic 59.3% |
| Creek | 0.0 /100 | #291 | Tragic 59.3% |
| Nicaraguans | 0.0 /100 | #292 | Tragic 59.2% |
| Seminole | 0.0 /100 | #293 | Tragic 59.1% |
| Immigrants | Belize | 0.0 /100 | #294 | Tragic 59.1% |
| Immigrants | Grenada | 0.0 /100 | #295 | Tragic 59.1% |
| Central American Indians | 0.0 /100 | #296 | Tragic 59.0% |
| Guyanese | 0.0 /100 | #297 | Tragic 59.0% |
| Immigrants | Ecuador | 0.0 /100 | #298 | Tragic 58.7% |
| Cubans | 0.0 /100 | #299 | Tragic 58.6% |
| Immigrants | Guyana | 0.0 /100 | #300 | Tragic 58.5% |
| Mexican American Indians | 0.0 /100 | #301 | Tragic 58.1% |
| Apache | 0.0 /100 | #302 | Tragic 58.0% |
| Immigrants | Dominica | 0.0 /100 | #303 | Tragic 57.9% |
| Kiowa | 0.0 /100 | #304 | Tragic 57.8% |