Immigrants from Jamaica vs British West Indian College, Under 1 year
COMPARE
Immigrants from Jamaica
British West Indian
College, Under 1 year
College, Under 1 year Comparison
Immigrants from Jamaica
British West Indians
59.7%
COLLEGE, UNDER 1 YEAR
0.0/ 100
METRIC RATING
283rd/ 347
METRIC RANK
59.5%
COLLEGE, UNDER 1 YEAR
0.0/ 100
METRIC RATING
286th/ 347
METRIC RANK
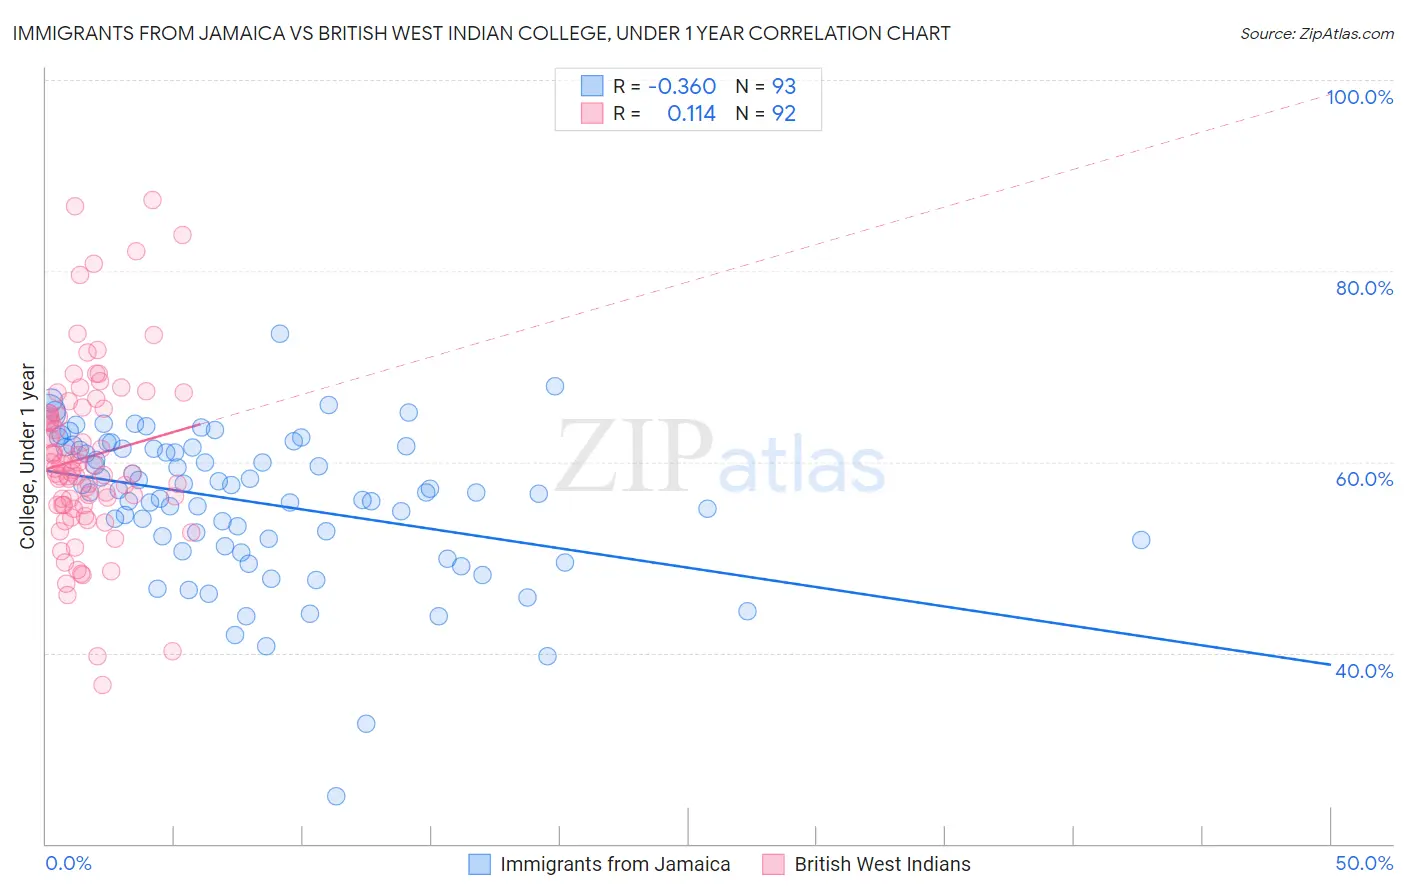
Immigrants from Jamaica vs British West Indian College, Under 1 year Correlation Chart
The statistical analysis conducted on geographies consisting of 301,826,603 people shows a mild negative correlation between the proportion of Immigrants from Jamaica and percentage of population with at least college, under 1 year education in the United States with a correlation coefficient (R) of -0.360 and weighted average of 59.7%. Similarly, the statistical analysis conducted on geographies consisting of 152,695,779 people shows a poor positive correlation between the proportion of British West Indians and percentage of population with at least college, under 1 year education in the United States with a correlation coefficient (R) of 0.114 and weighted average of 59.5%, a difference of 0.27%.
College, Under 1 year Correlation Summary
| Measurement | Immigrants from Jamaica | British West Indian |
| Minimum | 24.9% | 36.6% |
| Maximum | 73.4% | 87.5% |
| Range | 48.5% | 50.8% |
| Mean | 55.8% | 60.5% |
| Median | 56.8% | 59.2% |
| Interquartile 25% (IQ1) | 51.5% | 55.5% |
| Interquartile 75% (IQ3) | 61.5% | 65.3% |
| Interquartile Range (IQR) | 10.0% | 9.8% |
| Standard Deviation (Sample) | 7.9% | 9.4% |
| Standard Deviation (Population) | 7.8% | 9.3% |
Demographics Similar to Immigrants from Jamaica and British West Indians by College, Under 1 year
In terms of college, under 1 year, the demographic groups most similar to Immigrants from Jamaica are Immigrants from St. Vincent and the Grenadines (59.6%, a difference of 0.11%), Paiute (59.6%, a difference of 0.12%), Sioux (59.4%, a difference of 0.44%), Black/African American (59.4%, a difference of 0.54%), and Choctaw (59.3%, a difference of 0.61%). Similarly, the demographic groups most similar to British West Indians are Paiute (59.6%, a difference of 0.14%), Immigrants from St. Vincent and the Grenadines (59.6%, a difference of 0.15%), Sioux (59.4%, a difference of 0.17%), Black/African American (59.4%, a difference of 0.27%), and Choctaw (59.3%, a difference of 0.34%).
| Demographics | Rating | Rank | College, Under 1 year |
| Alaska Natives | 0.1 /100 | #274 | Tragic 60.4% |
| Immigrants | Barbados | 0.1 /100 | #275 | Tragic 60.4% |
| Arapaho | 0.1 /100 | #276 | Tragic 60.3% |
| Bahamians | 0.1 /100 | #277 | Tragic 60.3% |
| Yaqui | 0.1 /100 | #278 | Tragic 60.2% |
| Ute | 0.1 /100 | #279 | Tragic 60.2% |
| Crow | 0.1 /100 | #280 | Tragic 60.2% |
| Cherokee | 0.1 /100 | #281 | Tragic 60.1% |
| Belizeans | 0.1 /100 | #282 | Tragic 60.1% |
| Immigrants | Jamaica | 0.0 /100 | #283 | Tragic 59.7% |
| Immigrants | St. Vincent and the Grenadines | 0.0 /100 | #284 | Tragic 59.6% |
| Paiute | 0.0 /100 | #285 | Tragic 59.6% |
| British West Indians | 0.0 /100 | #286 | Tragic 59.5% |
| Sioux | 0.0 /100 | #287 | Tragic 59.4% |
| Blacks/African Americans | 0.0 /100 | #288 | Tragic 59.4% |
| Choctaw | 0.0 /100 | #289 | Tragic 59.3% |
| Ecuadorians | 0.0 /100 | #290 | Tragic 59.3% |
| Creek | 0.0 /100 | #291 | Tragic 59.3% |
| Nicaraguans | 0.0 /100 | #292 | Tragic 59.2% |
| Seminole | 0.0 /100 | #293 | Tragic 59.1% |
| Immigrants | Belize | 0.0 /100 | #294 | Tragic 59.1% |