Immigrants from Grenada vs British West Indian College, Under 1 year
COMPARE
Immigrants from Grenada
British West Indian
College, Under 1 year
College, Under 1 year Comparison
Immigrants from Grenada
British West Indians
59.1%
COLLEGE, UNDER 1 YEAR
0.0/ 100
METRIC RATING
295th/ 347
METRIC RANK
59.5%
COLLEGE, UNDER 1 YEAR
0.0/ 100
METRIC RATING
286th/ 347
METRIC RANK
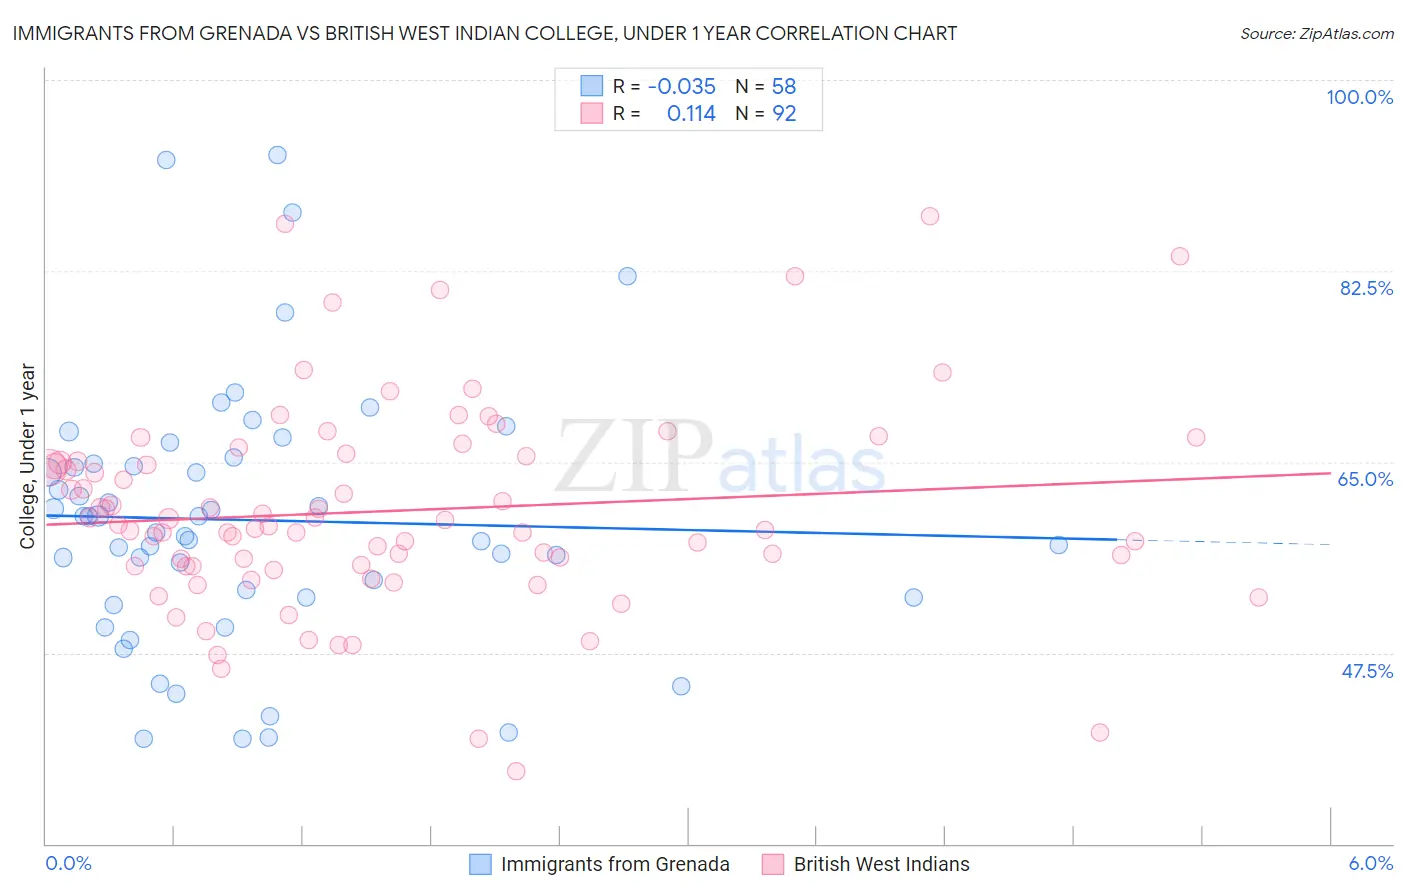
Immigrants from Grenada vs British West Indian College, Under 1 year Correlation Chart
The statistical analysis conducted on geographies consisting of 67,201,096 people shows no correlation between the proportion of Immigrants from Grenada and percentage of population with at least college, under 1 year education in the United States with a correlation coefficient (R) of -0.035 and weighted average of 59.1%. Similarly, the statistical analysis conducted on geographies consisting of 152,695,779 people shows a poor positive correlation between the proportion of British West Indians and percentage of population with at least college, under 1 year education in the United States with a correlation coefficient (R) of 0.114 and weighted average of 59.5%, a difference of 0.82%.
College, Under 1 year Correlation Summary
| Measurement | Immigrants from Grenada | British West Indian |
| Minimum | 39.6% | 36.6% |
| Maximum | 93.2% | 87.5% |
| Range | 53.6% | 50.8% |
| Mean | 59.7% | 60.5% |
| Median | 59.3% | 59.2% |
| Interquartile 25% (IQ1) | 52.6% | 55.5% |
| Interquartile 75% (IQ3) | 64.8% | 65.3% |
| Interquartile Range (IQR) | 12.2% | 9.8% |
| Standard Deviation (Sample) | 11.9% | 9.4% |
| Standard Deviation (Population) | 11.8% | 9.3% |
Demographics Similar to Immigrants from Grenada and British West Indians by College, Under 1 year
In terms of college, under 1 year, the demographic groups most similar to Immigrants from Grenada are Central American Indian (59.0%, a difference of 0.040%), Guyanese (59.0%, a difference of 0.080%), Immigrants from Belize (59.1%, a difference of 0.10%), Seminole (59.1%, a difference of 0.12%), and Nicaraguan (59.2%, a difference of 0.31%). Similarly, the demographic groups most similar to British West Indians are Paiute (59.6%, a difference of 0.14%), Immigrants from St. Vincent and the Grenadines (59.6%, a difference of 0.15%), Sioux (59.4%, a difference of 0.17%), Immigrants from Jamaica (59.7%, a difference of 0.27%), and Black/African American (59.4%, a difference of 0.27%).
| Demographics | Rating | Rank | College, Under 1 year |
| Crow | 0.1 /100 | #280 | Tragic 60.2% |
| Cherokee | 0.1 /100 | #281 | Tragic 60.1% |
| Belizeans | 0.1 /100 | #282 | Tragic 60.1% |
| Immigrants | Jamaica | 0.0 /100 | #283 | Tragic 59.7% |
| Immigrants | St. Vincent and the Grenadines | 0.0 /100 | #284 | Tragic 59.6% |
| Paiute | 0.0 /100 | #285 | Tragic 59.6% |
| British West Indians | 0.0 /100 | #286 | Tragic 59.5% |
| Sioux | 0.0 /100 | #287 | Tragic 59.4% |
| Blacks/African Americans | 0.0 /100 | #288 | Tragic 59.4% |
| Choctaw | 0.0 /100 | #289 | Tragic 59.3% |
| Ecuadorians | 0.0 /100 | #290 | Tragic 59.3% |
| Creek | 0.0 /100 | #291 | Tragic 59.3% |
| Nicaraguans | 0.0 /100 | #292 | Tragic 59.2% |
| Seminole | 0.0 /100 | #293 | Tragic 59.1% |
| Immigrants | Belize | 0.0 /100 | #294 | Tragic 59.1% |
| Immigrants | Grenada | 0.0 /100 | #295 | Tragic 59.1% |
| Central American Indians | 0.0 /100 | #296 | Tragic 59.0% |
| Guyanese | 0.0 /100 | #297 | Tragic 59.0% |
| Immigrants | Ecuador | 0.0 /100 | #298 | Tragic 58.7% |
| Cubans | 0.0 /100 | #299 | Tragic 58.6% |
| Immigrants | Guyana | 0.0 /100 | #300 | Tragic 58.5% |