Serbian vs Immigrants from Guyana College, Under 1 year
COMPARE
Serbian
Immigrants from Guyana
College, Under 1 year
College, Under 1 year Comparison
Serbians
Immigrants from Guyana
67.4%
COLLEGE, UNDER 1 YEAR
93.9/ 100
METRIC RATING
120th/ 347
METRIC RANK
58.5%
COLLEGE, UNDER 1 YEAR
0.0/ 100
METRIC RATING
300th/ 347
METRIC RANK
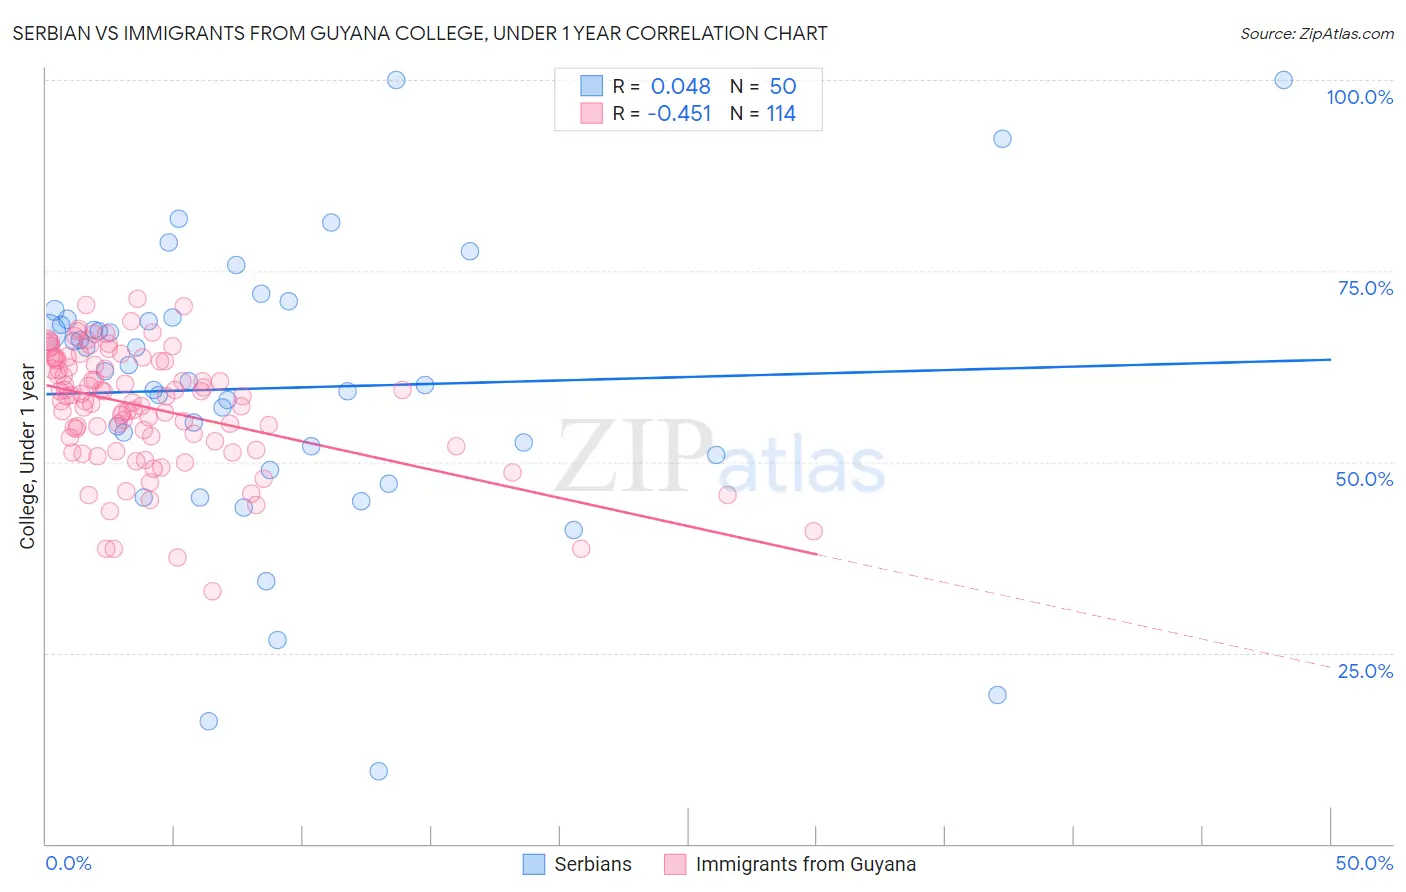
Serbian vs Immigrants from Guyana College, Under 1 year Correlation Chart
The statistical analysis conducted on geographies consisting of 267,640,905 people shows no correlation between the proportion of Serbians and percentage of population with at least college, under 1 year education in the United States with a correlation coefficient (R) of 0.048 and weighted average of 67.4%. Similarly, the statistical analysis conducted on geographies consisting of 183,735,121 people shows a moderate negative correlation between the proportion of Immigrants from Guyana and percentage of population with at least college, under 1 year education in the United States with a correlation coefficient (R) of -0.451 and weighted average of 58.5%, a difference of 15.2%.
College, Under 1 year Correlation Summary
| Measurement | Serbian | Immigrants from Guyana |
| Minimum | 9.5% | 33.1% |
| Maximum | 100.0% | 71.3% |
| Range | 90.5% | 38.3% |
| Mean | 59.7% | 57.1% |
| Median | 61.2% | 58.5% |
| Interquartile 25% (IQ1) | 50.9% | 52.6% |
| Interquartile 75% (IQ3) | 68.7% | 63.2% |
| Interquartile Range (IQR) | 17.7% | 10.6% |
| Standard Deviation (Sample) | 18.5% | 7.8% |
| Standard Deviation (Population) | 18.3% | 7.8% |
Similar Demographics by College, Under 1 year
Demographics Similar to Serbians by College, Under 1 year
In terms of college, under 1 year, the demographic groups most similar to Serbians are Slovene (67.3%, a difference of 0.10%), Lebanese (67.5%, a difference of 0.15%), Immigrants from Ukraine (67.5%, a difference of 0.16%), Pakistani (67.5%, a difference of 0.18%), and Immigrants from Jordan (67.3%, a difference of 0.18%).
| Demographics | Rating | Rank | College, Under 1 year |
| Syrians | 95.6 /100 | #113 | Exceptional 67.6% |
| Chileans | 95.3 /100 | #114 | Exceptional 67.6% |
| Basques | 95.2 /100 | #115 | Exceptional 67.6% |
| Immigrants | Nepal | 94.9 /100 | #116 | Exceptional 67.5% |
| Pakistanis | 94.8 /100 | #117 | Exceptional 67.5% |
| Immigrants | Ukraine | 94.7 /100 | #118 | Exceptional 67.5% |
| Lebanese | 94.6 /100 | #119 | Exceptional 67.5% |
| Serbians | 93.9 /100 | #120 | Exceptional 67.4% |
| Slovenes | 93.3 /100 | #121 | Exceptional 67.3% |
| Immigrants | Jordan | 92.8 /100 | #122 | Exceptional 67.3% |
| Immigrants | Northern Africa | 92.7 /100 | #123 | Exceptional 67.2% |
| Arabs | 92.6 /100 | #124 | Exceptional 67.2% |
| Italians | 91.8 /100 | #125 | Exceptional 67.2% |
| Alsatians | 91.3 /100 | #126 | Exceptional 67.1% |
| Czechs | 90.8 /100 | #127 | Exceptional 67.1% |
Demographics Similar to Immigrants from Guyana by College, Under 1 year
In terms of college, under 1 year, the demographic groups most similar to Immigrants from Guyana are Cuban (58.6%, a difference of 0.26%), Immigrants from Ecuador (58.7%, a difference of 0.39%), Mexican American Indian (58.1%, a difference of 0.62%), Apache (58.0%, a difference of 0.81%), and Guyanese (59.0%, a difference of 0.89%).
| Demographics | Rating | Rank | College, Under 1 year |
| Seminole | 0.0 /100 | #293 | Tragic 59.1% |
| Immigrants | Belize | 0.0 /100 | #294 | Tragic 59.1% |
| Immigrants | Grenada | 0.0 /100 | #295 | Tragic 59.1% |
| Central American Indians | 0.0 /100 | #296 | Tragic 59.0% |
| Guyanese | 0.0 /100 | #297 | Tragic 59.0% |
| Immigrants | Ecuador | 0.0 /100 | #298 | Tragic 58.7% |
| Cubans | 0.0 /100 | #299 | Tragic 58.6% |
| Immigrants | Guyana | 0.0 /100 | #300 | Tragic 58.5% |
| Mexican American Indians | 0.0 /100 | #301 | Tragic 58.1% |
| Apache | 0.0 /100 | #302 | Tragic 58.0% |
| Immigrants | Dominica | 0.0 /100 | #303 | Tragic 57.9% |
| Kiowa | 0.0 /100 | #304 | Tragic 57.8% |
| Haitians | 0.0 /100 | #305 | Tragic 57.8% |
| Immigrants | Portugal | 0.0 /100 | #306 | Tragic 57.7% |
| Fijians | 0.0 /100 | #307 | Tragic 57.7% |