Senegalese vs Immigrants from Laos Master's Degree
COMPARE
Senegalese
Immigrants from Laos
Master's Degree
Master's Degree Comparison
Senegalese
Immigrants from Laos
15.2%
MASTER'S DEGREE
65.6/ 100
METRIC RATING
167th/ 347
METRIC RANK
11.4%
MASTER'S DEGREE
0.1/ 100
METRIC RATING
303rd/ 347
METRIC RANK
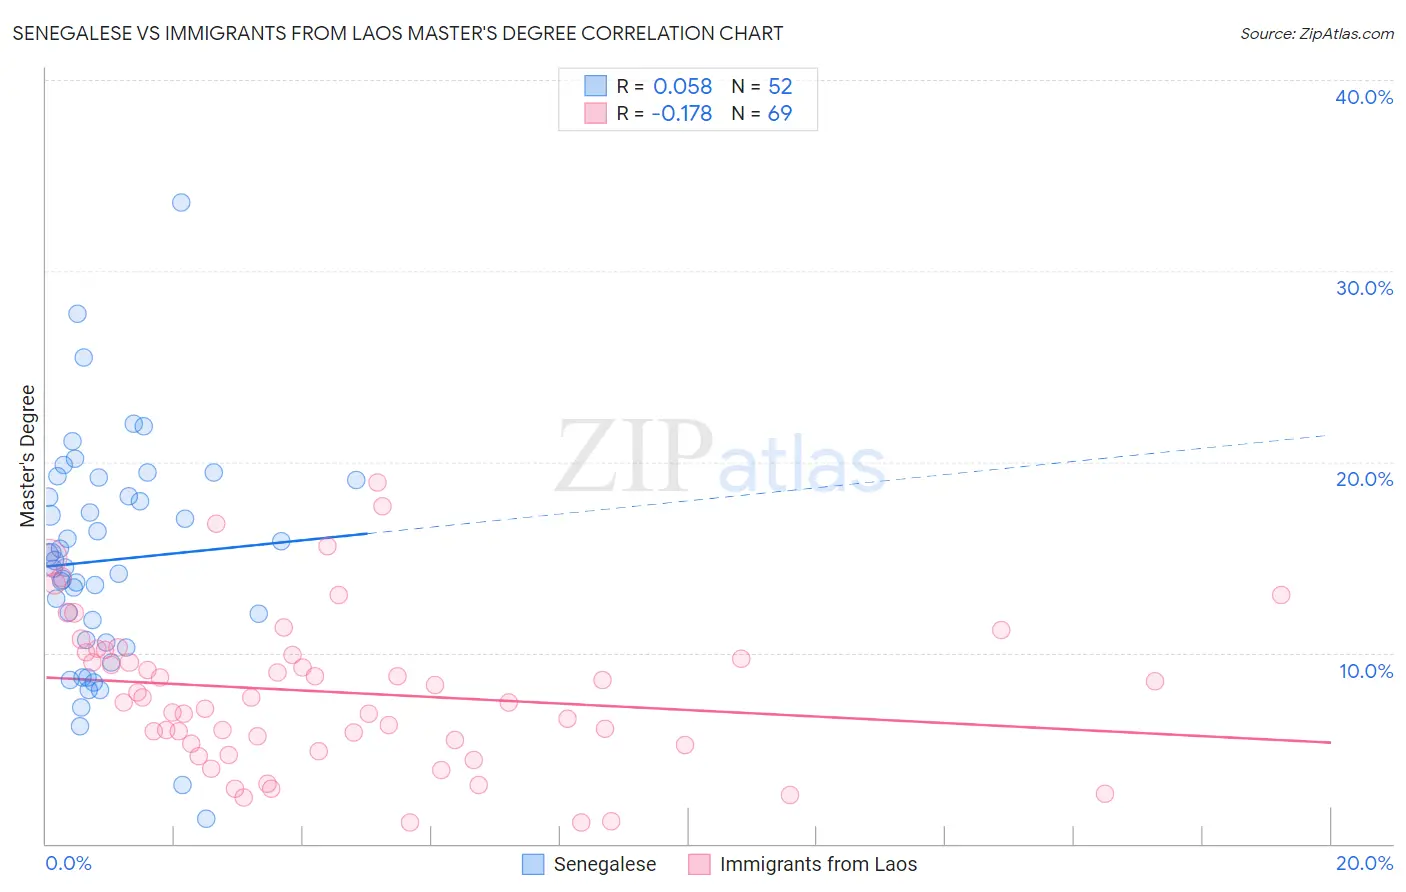
Senegalese vs Immigrants from Laos Master's Degree Correlation Chart
The statistical analysis conducted on geographies consisting of 78,095,521 people shows a slight positive correlation between the proportion of Senegalese and percentage of population with at least master's degree education in the United States with a correlation coefficient (R) of 0.058 and weighted average of 15.2%. Similarly, the statistical analysis conducted on geographies consisting of 201,443,895 people shows a poor negative correlation between the proportion of Immigrants from Laos and percentage of population with at least master's degree education in the United States with a correlation coefficient (R) of -0.178 and weighted average of 11.4%, a difference of 34.0%.
Master's Degree Correlation Summary
| Measurement | Senegalese | Immigrants from Laos |
| Minimum | 1.3% | 1.1% |
| Maximum | 33.6% | 18.9% |
| Range | 32.3% | 17.8% |
| Mean | 14.8% | 7.9% |
| Median | 14.7% | 7.7% |
| Interquartile 25% (IQ1) | 10.6% | 5.2% |
| Interquartile 75% (IQ3) | 18.6% | 10.1% |
| Interquartile Range (IQR) | 8.0% | 4.9% |
| Standard Deviation (Sample) | 5.9% | 4.0% |
| Standard Deviation (Population) | 5.9% | 4.0% |
Similar Demographics by Master's Degree
Demographics Similar to Senegalese by Master's Degree
In terms of master's degree, the demographic groups most similar to Senegalese are Swedish (15.2%, a difference of 0.070%), Immigrants from North Macedonia (15.2%, a difference of 0.14%), Immigrants from Kenya (15.3%, a difference of 0.15%), Colombian (15.3%, a difference of 0.19%), and Uruguayan (15.3%, a difference of 0.21%).
| Demographics | Rating | Rank | Master's Degree |
| Kenyans | 70.3 /100 | #160 | Good 15.3% |
| Sudanese | 68.7 /100 | #161 | Good 15.3% |
| Peruvians | 68.7 /100 | #162 | Good 15.3% |
| Uruguayans | 67.1 /100 | #163 | Good 15.3% |
| Colombians | 66.9 /100 | #164 | Good 15.3% |
| Immigrants | Kenya | 66.6 /100 | #165 | Good 15.3% |
| Swedes | 66.1 /100 | #166 | Good 15.2% |
| Senegalese | 65.6 /100 | #167 | Good 15.2% |
| Immigrants | North Macedonia | 64.5 /100 | #168 | Good 15.2% |
| Scottish | 62.7 /100 | #169 | Good 15.2% |
| Irish | 56.3 /100 | #170 | Average 15.0% |
| Immigrants | Ghana | 53.6 /100 | #171 | Average 15.0% |
| Immigrants | Uruguay | 52.8 /100 | #172 | Average 15.0% |
| Costa Ricans | 52.5 /100 | #173 | Average 15.0% |
| Slovaks | 50.0 /100 | #174 | Average 14.9% |
Demographics Similar to Immigrants from Laos by Master's Degree
In terms of master's degree, the demographic groups most similar to Immigrants from Laos are Cherokee (11.4%, a difference of 0.020%), Immigrants from Cabo Verde (11.3%, a difference of 0.19%), Tsimshian (11.4%, a difference of 0.33%), Chippewa (11.4%, a difference of 0.49%), and Chickasaw (11.4%, a difference of 0.51%).
| Demographics | Rating | Rank | Master's Degree |
| Alaskan Athabascans | 0.1 /100 | #296 | Tragic 11.6% |
| Immigrants | Yemen | 0.1 /100 | #297 | Tragic 11.6% |
| Samoans | 0.1 /100 | #298 | Tragic 11.5% |
| Chickasaw | 0.1 /100 | #299 | Tragic 11.4% |
| Chippewa | 0.1 /100 | #300 | Tragic 11.4% |
| Tsimshian | 0.1 /100 | #301 | Tragic 11.4% |
| Cherokee | 0.1 /100 | #302 | Tragic 11.4% |
| Immigrants | Laos | 0.1 /100 | #303 | Tragic 11.4% |
| Immigrants | Cabo Verde | 0.1 /100 | #304 | Tragic 11.3% |
| Immigrants | Latin America | 0.0 /100 | #305 | Tragic 11.3% |
| Mexican American Indians | 0.0 /100 | #306 | Tragic 11.2% |
| Cheyenne | 0.0 /100 | #307 | Tragic 11.2% |
| Puerto Ricans | 0.0 /100 | #308 | Tragic 11.2% |
| Puget Sound Salish | 0.0 /100 | #309 | Tragic 11.1% |
| Shoshone | 0.0 /100 | #310 | Tragic 11.1% |