Asian vs Immigrants from Laos Master's Degree
COMPARE
Asian
Immigrants from Laos
Master's Degree
Master's Degree Comparison
Asians
Immigrants from Laos
18.4%
MASTER'S DEGREE
99.9/ 100
METRIC RATING
56th/ 347
METRIC RANK
11.4%
MASTER'S DEGREE
0.1/ 100
METRIC RATING
303rd/ 347
METRIC RANK
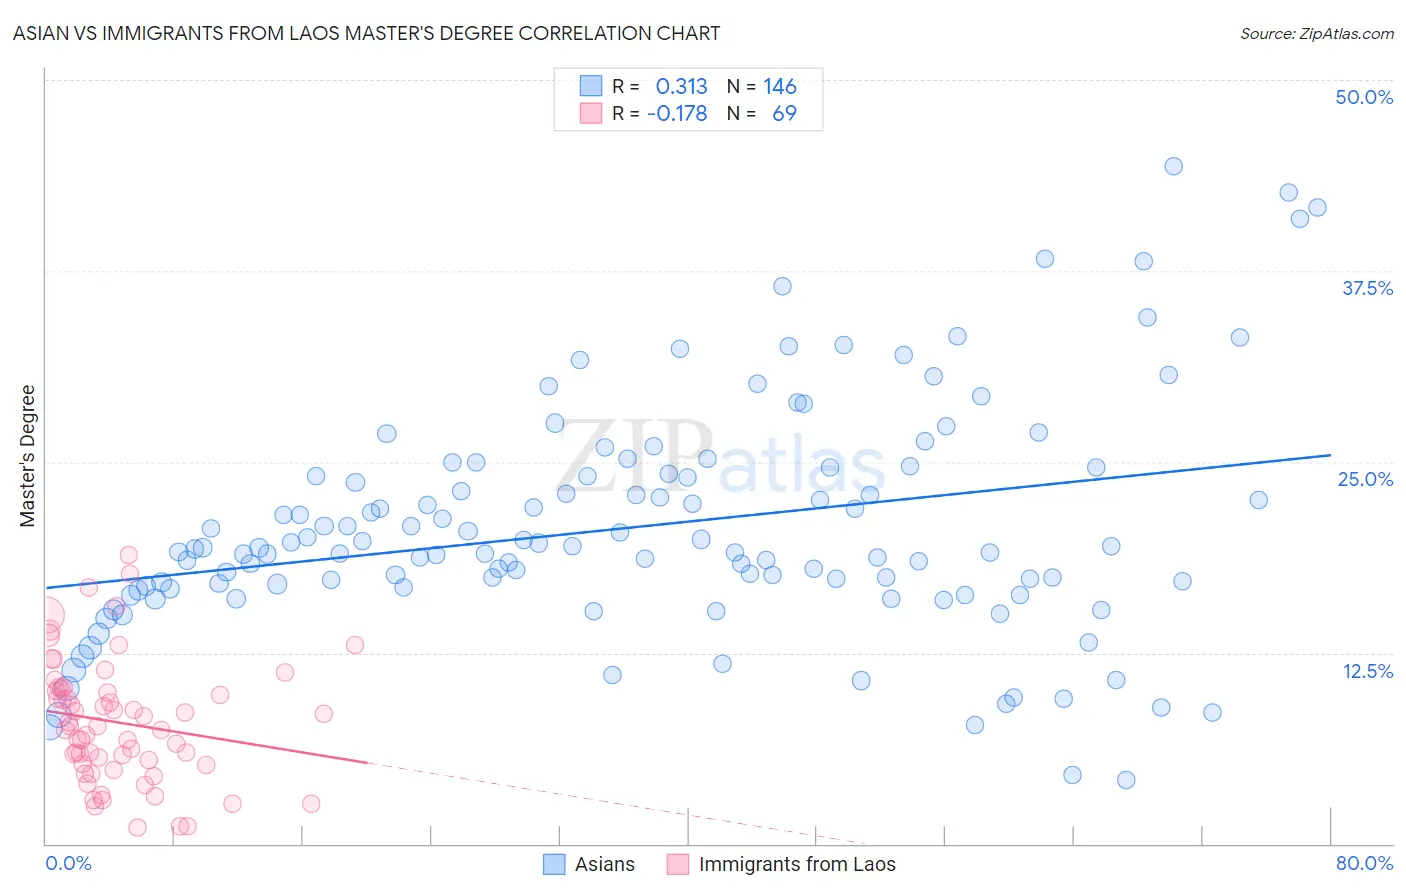
Asian vs Immigrants from Laos Master's Degree Correlation Chart
The statistical analysis conducted on geographies consisting of 550,412,618 people shows a mild positive correlation between the proportion of Asians and percentage of population with at least master's degree education in the United States with a correlation coefficient (R) of 0.313 and weighted average of 18.4%. Similarly, the statistical analysis conducted on geographies consisting of 201,443,895 people shows a poor negative correlation between the proportion of Immigrants from Laos and percentage of population with at least master's degree education in the United States with a correlation coefficient (R) of -0.178 and weighted average of 11.4%, a difference of 62.3%.
Master's Degree Correlation Summary
| Measurement | Asian | Immigrants from Laos |
| Minimum | 4.2% | 1.1% |
| Maximum | 44.3% | 18.9% |
| Range | 40.2% | 17.8% |
| Mean | 20.7% | 7.9% |
| Median | 19.3% | 7.7% |
| Interquartile 25% (IQ1) | 16.8% | 5.2% |
| Interquartile 75% (IQ3) | 24.2% | 10.1% |
| Interquartile Range (IQR) | 7.4% | 4.9% |
| Standard Deviation (Sample) | 7.5% | 4.0% |
| Standard Deviation (Population) | 7.5% | 4.0% |
Similar Demographics by Master's Degree
Demographics Similar to Asians by Master's Degree
In terms of master's degree, the demographic groups most similar to Asians are Immigrants from Asia (18.4%, a difference of 0.14%), Immigrants from Serbia (18.5%, a difference of 0.22%), Immigrants from Lithuania (18.5%, a difference of 0.26%), Australian (18.4%, a difference of 0.27%), and Immigrants from Czechoslovakia (18.5%, a difference of 0.57%).
| Demographics | Rating | Rank | Master's Degree |
| Estonians | 100.0 /100 | #49 | Exceptional 18.8% |
| Bulgarians | 100.0 /100 | #50 | Exceptional 18.8% |
| Immigrants | South Africa | 100.0 /100 | #51 | Exceptional 18.8% |
| Immigrants | Kuwait | 100.0 /100 | #52 | Exceptional 18.6% |
| Immigrants | Czechoslovakia | 99.9 /100 | #53 | Exceptional 18.5% |
| Immigrants | Lithuania | 99.9 /100 | #54 | Exceptional 18.5% |
| Immigrants | Serbia | 99.9 /100 | #55 | Exceptional 18.5% |
| Asians | 99.9 /100 | #56 | Exceptional 18.4% |
| Immigrants | Asia | 99.9 /100 | #57 | Exceptional 18.4% |
| Australians | 99.9 /100 | #58 | Exceptional 18.4% |
| Immigrants | Bulgaria | 99.9 /100 | #59 | Exceptional 18.3% |
| New Zealanders | 99.9 /100 | #60 | Exceptional 18.3% |
| Immigrants | Europe | 99.9 /100 | #61 | Exceptional 18.2% |
| Argentineans | 99.9 /100 | #62 | Exceptional 18.2% |
| Immigrants | Netherlands | 99.9 /100 | #63 | Exceptional 18.1% |
Demographics Similar to Immigrants from Laos by Master's Degree
In terms of master's degree, the demographic groups most similar to Immigrants from Laos are Cherokee (11.4%, a difference of 0.020%), Immigrants from Cabo Verde (11.3%, a difference of 0.19%), Tsimshian (11.4%, a difference of 0.33%), Chippewa (11.4%, a difference of 0.49%), and Chickasaw (11.4%, a difference of 0.51%).
| Demographics | Rating | Rank | Master's Degree |
| Alaskan Athabascans | 0.1 /100 | #296 | Tragic 11.6% |
| Immigrants | Yemen | 0.1 /100 | #297 | Tragic 11.6% |
| Samoans | 0.1 /100 | #298 | Tragic 11.5% |
| Chickasaw | 0.1 /100 | #299 | Tragic 11.4% |
| Chippewa | 0.1 /100 | #300 | Tragic 11.4% |
| Tsimshian | 0.1 /100 | #301 | Tragic 11.4% |
| Cherokee | 0.1 /100 | #302 | Tragic 11.4% |
| Immigrants | Laos | 0.1 /100 | #303 | Tragic 11.4% |
| Immigrants | Cabo Verde | 0.1 /100 | #304 | Tragic 11.3% |
| Immigrants | Latin America | 0.0 /100 | #305 | Tragic 11.3% |
| Mexican American Indians | 0.0 /100 | #306 | Tragic 11.2% |
| Cheyenne | 0.0 /100 | #307 | Tragic 11.2% |
| Puerto Ricans | 0.0 /100 | #308 | Tragic 11.2% |
| Puget Sound Salish | 0.0 /100 | #309 | Tragic 11.1% |
| Shoshone | 0.0 /100 | #310 | Tragic 11.1% |