Senegalese vs Immigrants from Haiti Master's Degree
COMPARE
Senegalese
Immigrants from Haiti
Master's Degree
Master's Degree Comparison
Senegalese
Immigrants from Haiti
15.2%
MASTER'S DEGREE
65.6/ 100
METRIC RATING
167th/ 347
METRIC RANK
11.8%
MASTER'S DEGREE
0.1/ 100
METRIC RATING
287th/ 347
METRIC RANK
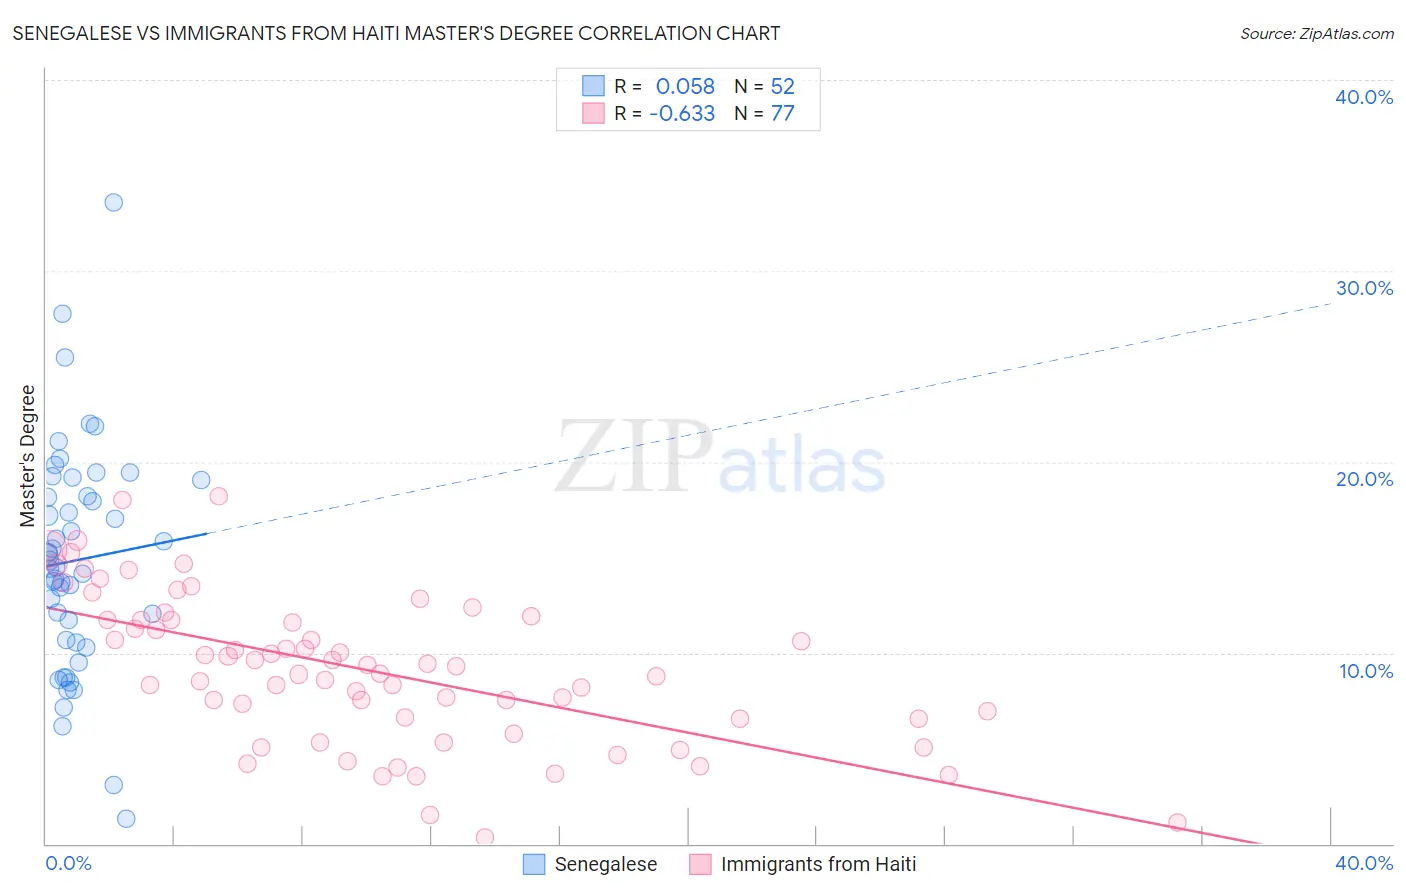
Senegalese vs Immigrants from Haiti Master's Degree Correlation Chart
The statistical analysis conducted on geographies consisting of 78,095,521 people shows a slight positive correlation between the proportion of Senegalese and percentage of population with at least master's degree education in the United States with a correlation coefficient (R) of 0.058 and weighted average of 15.2%. Similarly, the statistical analysis conducted on geographies consisting of 225,216,458 people shows a significant negative correlation between the proportion of Immigrants from Haiti and percentage of population with at least master's degree education in the United States with a correlation coefficient (R) of -0.633 and weighted average of 11.8%, a difference of 29.3%.
Master's Degree Correlation Summary
| Measurement | Senegalese | Immigrants from Haiti |
| Minimum | 1.3% | 0.34% |
| Maximum | 33.6% | 18.2% |
| Range | 32.3% | 17.8% |
| Mean | 14.8% | 9.1% |
| Median | 14.7% | 9.3% |
| Interquartile 25% (IQ1) | 10.6% | 6.5% |
| Interquartile 75% (IQ3) | 18.6% | 11.7% |
| Interquartile Range (IQR) | 8.0% | 5.2% |
| Standard Deviation (Sample) | 5.9% | 3.9% |
| Standard Deviation (Population) | 5.9% | 3.9% |
Similar Demographics by Master's Degree
Demographics Similar to Senegalese by Master's Degree
In terms of master's degree, the demographic groups most similar to Senegalese are Swedish (15.2%, a difference of 0.070%), Immigrants from North Macedonia (15.2%, a difference of 0.14%), Immigrants from Kenya (15.3%, a difference of 0.15%), Colombian (15.3%, a difference of 0.19%), and Uruguayan (15.3%, a difference of 0.21%).
| Demographics | Rating | Rank | Master's Degree |
| Kenyans | 70.3 /100 | #160 | Good 15.3% |
| Sudanese | 68.7 /100 | #161 | Good 15.3% |
| Peruvians | 68.7 /100 | #162 | Good 15.3% |
| Uruguayans | 67.1 /100 | #163 | Good 15.3% |
| Colombians | 66.9 /100 | #164 | Good 15.3% |
| Immigrants | Kenya | 66.6 /100 | #165 | Good 15.3% |
| Swedes | 66.1 /100 | #166 | Good 15.2% |
| Senegalese | 65.6 /100 | #167 | Good 15.2% |
| Immigrants | North Macedonia | 64.5 /100 | #168 | Good 15.2% |
| Scottish | 62.7 /100 | #169 | Good 15.2% |
| Irish | 56.3 /100 | #170 | Average 15.0% |
| Immigrants | Ghana | 53.6 /100 | #171 | Average 15.0% |
| Immigrants | Uruguay | 52.8 /100 | #172 | Average 15.0% |
| Costa Ricans | 52.5 /100 | #173 | Average 15.0% |
| Slovaks | 50.0 /100 | #174 | Average 14.9% |
Demographics Similar to Immigrants from Haiti by Master's Degree
In terms of master's degree, the demographic groups most similar to Immigrants from Haiti are Immigrants from Honduras (11.8%, a difference of 0.17%), Aleut (11.8%, a difference of 0.20%), Guatemalan (11.7%, a difference of 0.25%), Ute (11.7%, a difference of 0.49%), and Immigrants from Nicaragua (11.8%, a difference of 0.55%).
| Demographics | Rating | Rank | Master's Degree |
| Immigrants | Dominican Republic | 0.2 /100 | #280 | Tragic 12.1% |
| Malaysians | 0.2 /100 | #281 | Tragic 12.0% |
| Immigrants | El Salvador | 0.2 /100 | #282 | Tragic 12.0% |
| Hondurans | 0.2 /100 | #283 | Tragic 11.9% |
| Ottawa | 0.2 /100 | #284 | Tragic 11.9% |
| Immigrants | Nicaragua | 0.2 /100 | #285 | Tragic 11.8% |
| Aleuts | 0.1 /100 | #286 | Tragic 11.8% |
| Immigrants | Haiti | 0.1 /100 | #287 | Tragic 11.8% |
| Immigrants | Honduras | 0.1 /100 | #288 | Tragic 11.8% |
| Guatemalans | 0.1 /100 | #289 | Tragic 11.7% |
| Ute | 0.1 /100 | #290 | Tragic 11.7% |
| Colville | 0.1 /100 | #291 | Tragic 11.6% |
| Immigrants | Guatemala | 0.1 /100 | #292 | Tragic 11.6% |
| Alaska Natives | 0.1 /100 | #293 | Tragic 11.6% |
| Hawaiians | 0.1 /100 | #294 | Tragic 11.6% |