Cambodian vs Immigrants from Laos Master's Degree
COMPARE
Cambodian
Immigrants from Laos
Master's Degree
Master's Degree Comparison
Cambodians
Immigrants from Laos
20.0%
MASTER'S DEGREE
100.0/ 100
METRIC RATING
26th/ 347
METRIC RANK
11.4%
MASTER'S DEGREE
0.1/ 100
METRIC RATING
303rd/ 347
METRIC RANK
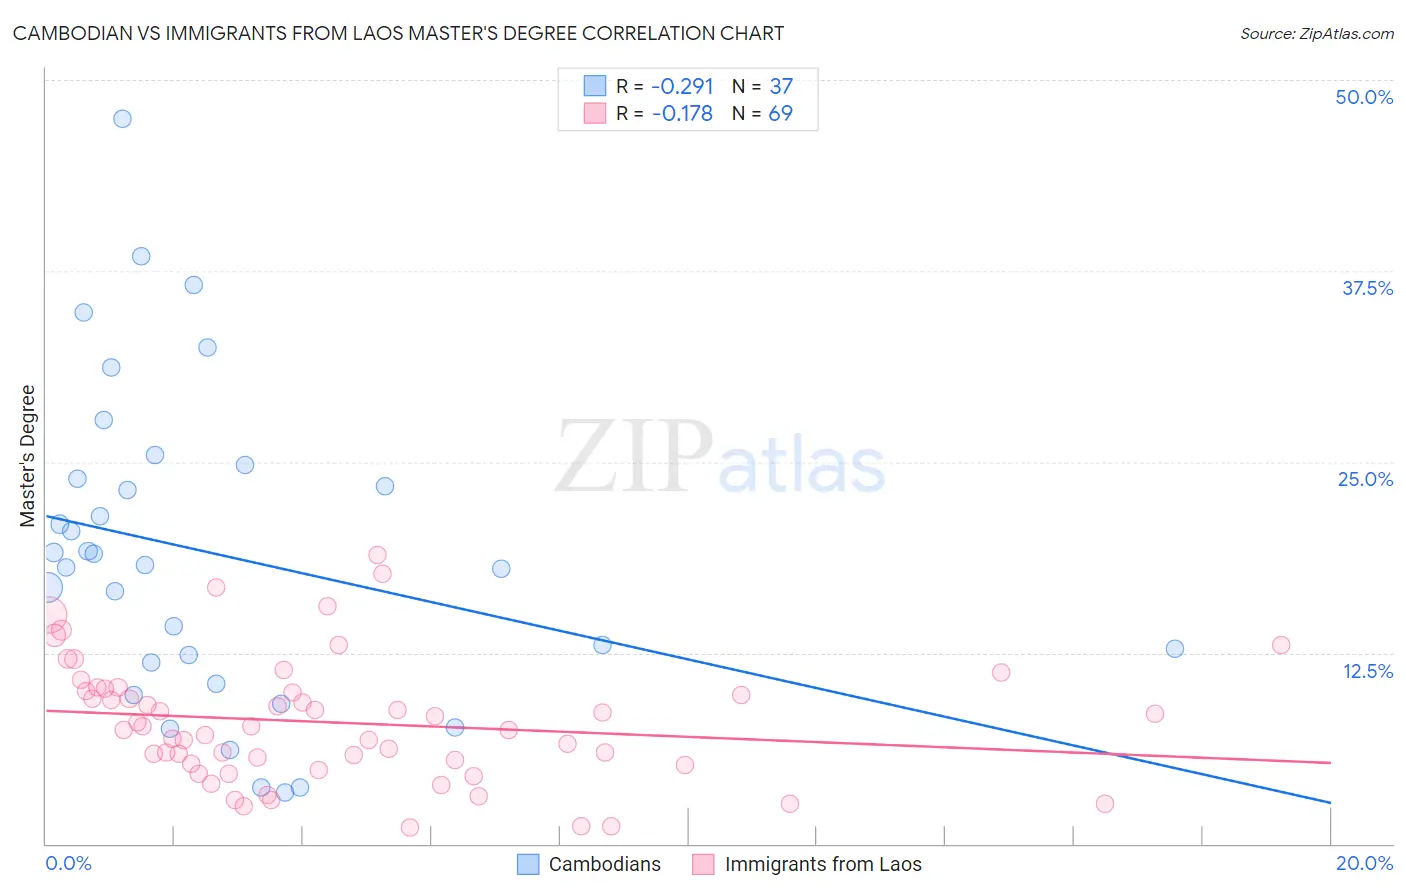
Cambodian vs Immigrants from Laos Master's Degree Correlation Chart
The statistical analysis conducted on geographies consisting of 102,506,989 people shows a weak negative correlation between the proportion of Cambodians and percentage of population with at least master's degree education in the United States with a correlation coefficient (R) of -0.291 and weighted average of 20.0%. Similarly, the statistical analysis conducted on geographies consisting of 201,443,895 people shows a poor negative correlation between the proportion of Immigrants from Laos and percentage of population with at least master's degree education in the United States with a correlation coefficient (R) of -0.178 and weighted average of 11.4%, a difference of 75.9%.
Master's Degree Correlation Summary
| Measurement | Cambodian | Immigrants from Laos |
| Minimum | 3.4% | 1.1% |
| Maximum | 47.4% | 18.9% |
| Range | 44.1% | 17.8% |
| Mean | 19.0% | 7.9% |
| Median | 18.3% | 7.7% |
| Interquartile 25% (IQ1) | 11.2% | 5.2% |
| Interquartile 75% (IQ3) | 24.3% | 10.1% |
| Interquartile Range (IQR) | 13.2% | 4.9% |
| Standard Deviation (Sample) | 10.4% | 4.0% |
| Standard Deviation (Population) | 10.3% | 4.0% |
Similar Demographics by Master's Degree
Demographics Similar to Cambodians by Master's Degree
In terms of master's degree, the demographic groups most similar to Cambodians are Immigrants from Japan (20.0%, a difference of 0.10%), Immigrants from Sri Lanka (19.9%, a difference of 0.41%), Turkish (19.9%, a difference of 0.48%), Latvian (19.8%, a difference of 0.89%), and Immigrants from Sweden (20.3%, a difference of 1.4%).
| Demographics | Rating | Rank | Master's Degree |
| Immigrants | Hong Kong | 100.0 /100 | #19 | Exceptional 20.5% |
| Indians (Asian) | 100.0 /100 | #20 | Exceptional 20.5% |
| Immigrants | Ireland | 100.0 /100 | #21 | Exceptional 20.4% |
| Israelis | 100.0 /100 | #22 | Exceptional 20.3% |
| Immigrants | France | 100.0 /100 | #23 | Exceptional 20.3% |
| Immigrants | Sweden | 100.0 /100 | #24 | Exceptional 20.3% |
| Immigrants | Japan | 100.0 /100 | #25 | Exceptional 20.0% |
| Cambodians | 100.0 /100 | #26 | Exceptional 20.0% |
| Immigrants | Sri Lanka | 100.0 /100 | #27 | Exceptional 19.9% |
| Turks | 100.0 /100 | #28 | Exceptional 19.9% |
| Latvians | 100.0 /100 | #29 | Exceptional 19.8% |
| Immigrants | Turkey | 100.0 /100 | #30 | Exceptional 19.7% |
| Immigrants | Korea | 100.0 /100 | #31 | Exceptional 19.7% |
| Burmese | 100.0 /100 | #32 | Exceptional 19.7% |
| Russians | 100.0 /100 | #33 | Exceptional 19.5% |
Demographics Similar to Immigrants from Laos by Master's Degree
In terms of master's degree, the demographic groups most similar to Immigrants from Laos are Cherokee (11.4%, a difference of 0.020%), Immigrants from Cabo Verde (11.3%, a difference of 0.19%), Tsimshian (11.4%, a difference of 0.33%), Chippewa (11.4%, a difference of 0.49%), and Chickasaw (11.4%, a difference of 0.51%).
| Demographics | Rating | Rank | Master's Degree |
| Alaskan Athabascans | 0.1 /100 | #296 | Tragic 11.6% |
| Immigrants | Yemen | 0.1 /100 | #297 | Tragic 11.6% |
| Samoans | 0.1 /100 | #298 | Tragic 11.5% |
| Chickasaw | 0.1 /100 | #299 | Tragic 11.4% |
| Chippewa | 0.1 /100 | #300 | Tragic 11.4% |
| Tsimshian | 0.1 /100 | #301 | Tragic 11.4% |
| Cherokee | 0.1 /100 | #302 | Tragic 11.4% |
| Immigrants | Laos | 0.1 /100 | #303 | Tragic 11.4% |
| Immigrants | Cabo Verde | 0.1 /100 | #304 | Tragic 11.3% |
| Immigrants | Latin America | 0.0 /100 | #305 | Tragic 11.3% |
| Mexican American Indians | 0.0 /100 | #306 | Tragic 11.2% |
| Cheyenne | 0.0 /100 | #307 | Tragic 11.2% |
| Puerto Ricans | 0.0 /100 | #308 | Tragic 11.2% |
| Puget Sound Salish | 0.0 /100 | #309 | Tragic 11.1% |
| Shoshone | 0.0 /100 | #310 | Tragic 11.1% |