Spanish American vs Immigrants from Laos Master's Degree
COMPARE
Spanish American
Immigrants from Laos
Master's Degree
Master's Degree Comparison
Spanish Americans
Immigrants from Laos
13.0%
MASTER'S DEGREE
1.9/ 100
METRIC RATING
242nd/ 347
METRIC RANK
11.4%
MASTER'S DEGREE
0.1/ 100
METRIC RATING
303rd/ 347
METRIC RANK
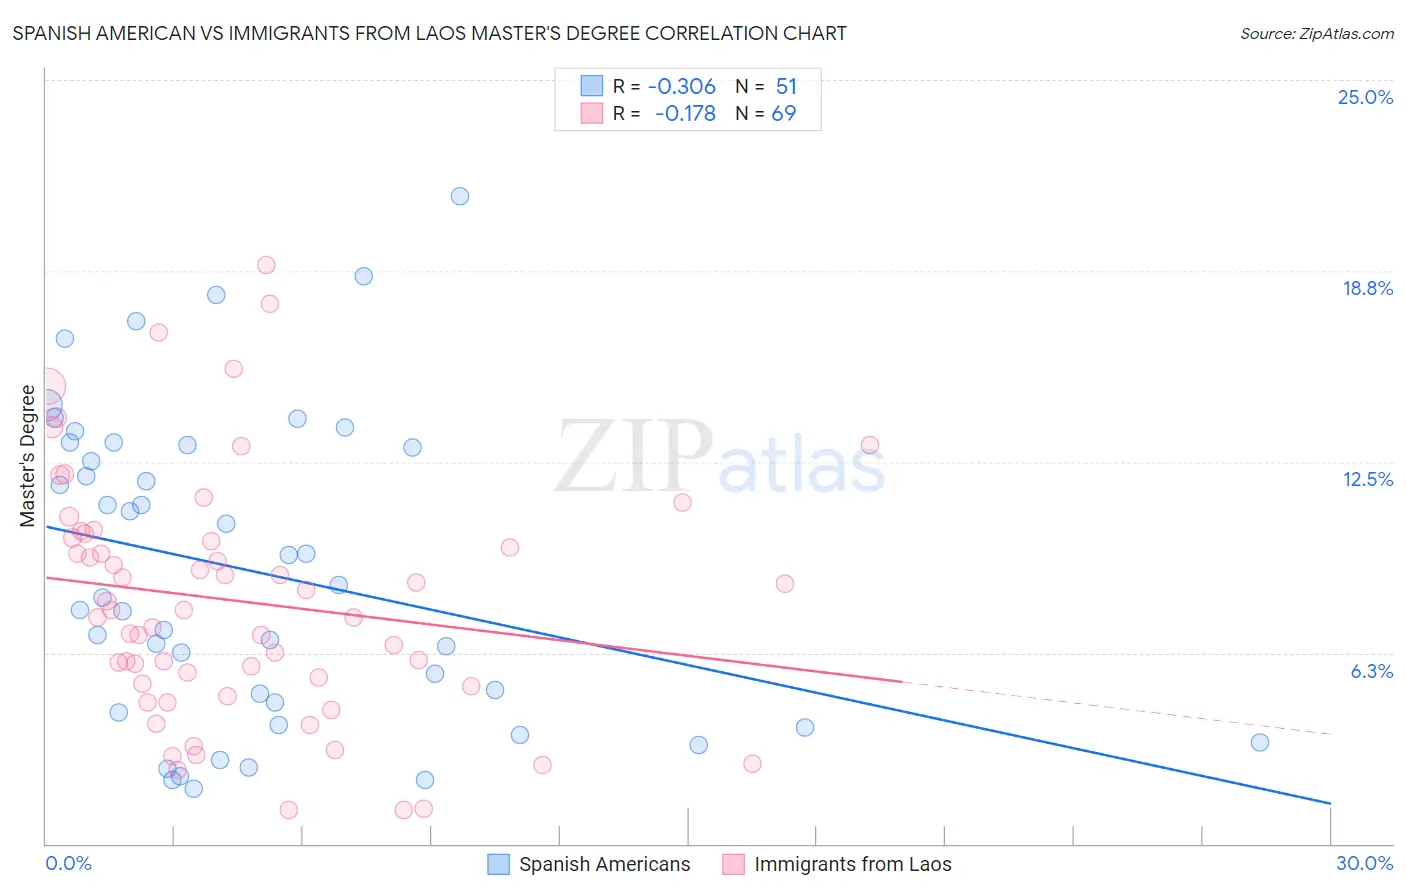
Spanish American vs Immigrants from Laos Master's Degree Correlation Chart
The statistical analysis conducted on geographies consisting of 103,160,270 people shows a mild negative correlation between the proportion of Spanish Americans and percentage of population with at least master's degree education in the United States with a correlation coefficient (R) of -0.306 and weighted average of 13.0%. Similarly, the statistical analysis conducted on geographies consisting of 201,443,895 people shows a poor negative correlation between the proportion of Immigrants from Laos and percentage of population with at least master's degree education in the United States with a correlation coefficient (R) of -0.178 and weighted average of 11.4%, a difference of 14.8%.
Master's Degree Correlation Summary
| Measurement | Spanish American | Immigrants from Laos |
| Minimum | 1.8% | 1.1% |
| Maximum | 21.2% | 18.9% |
| Range | 19.4% | 17.8% |
| Mean | 8.9% | 7.9% |
| Median | 8.0% | 7.7% |
| Interquartile 25% (IQ1) | 4.3% | 5.2% |
| Interquartile 75% (IQ3) | 13.1% | 10.1% |
| Interquartile Range (IQR) | 8.8% | 4.9% |
| Standard Deviation (Sample) | 5.0% | 4.0% |
| Standard Deviation (Population) | 5.0% | 4.0% |
Similar Demographics by Master's Degree
Demographics Similar to Spanish Americans by Master's Degree
In terms of master's degree, the demographic groups most similar to Spanish Americans are Immigrants from Jamaica (13.0%, a difference of 0.040%), U.S. Virgin Islander (13.1%, a difference of 0.28%), Delaware (13.0%, a difference of 0.42%), Guamanian/Chamorro (13.1%, a difference of 0.43%), and Immigrants from Bahamas (12.9%, a difference of 1.1%).
| Demographics | Rating | Rank | Master's Degree |
| German Russians | 4.5 /100 | #235 | Tragic 13.5% |
| Immigrants | Guyana | 4.4 /100 | #236 | Tragic 13.4% |
| Jamaicans | 4.1 /100 | #237 | Tragic 13.4% |
| Hmong | 4.0 /100 | #238 | Tragic 13.4% |
| Immigrants | Nonimmigrants | 3.4 /100 | #239 | Tragic 13.3% |
| Guamanians/Chamorros | 2.2 /100 | #240 | Tragic 13.1% |
| U.S. Virgin Islanders | 2.1 /100 | #241 | Tragic 13.1% |
| Spanish Americans | 1.9 /100 | #242 | Tragic 13.0% |
| Immigrants | Jamaica | 1.9 /100 | #243 | Tragic 13.0% |
| Delaware | 1.7 /100 | #244 | Tragic 13.0% |
| Immigrants | Bahamas | 1.4 /100 | #245 | Tragic 12.9% |
| Immigrants | Cambodia | 1.4 /100 | #246 | Tragic 12.9% |
| Iroquois | 1.4 /100 | #247 | Tragic 12.9% |
| Africans | 1.4 /100 | #248 | Tragic 12.9% |
| Cree | 1.3 /100 | #249 | Tragic 12.8% |
Demographics Similar to Immigrants from Laos by Master's Degree
In terms of master's degree, the demographic groups most similar to Immigrants from Laos are Cherokee (11.4%, a difference of 0.020%), Immigrants from Cabo Verde (11.3%, a difference of 0.19%), Tsimshian (11.4%, a difference of 0.33%), Chippewa (11.4%, a difference of 0.49%), and Chickasaw (11.4%, a difference of 0.51%).
| Demographics | Rating | Rank | Master's Degree |
| Alaskan Athabascans | 0.1 /100 | #296 | Tragic 11.6% |
| Immigrants | Yemen | 0.1 /100 | #297 | Tragic 11.6% |
| Samoans | 0.1 /100 | #298 | Tragic 11.5% |
| Chickasaw | 0.1 /100 | #299 | Tragic 11.4% |
| Chippewa | 0.1 /100 | #300 | Tragic 11.4% |
| Tsimshian | 0.1 /100 | #301 | Tragic 11.4% |
| Cherokee | 0.1 /100 | #302 | Tragic 11.4% |
| Immigrants | Laos | 0.1 /100 | #303 | Tragic 11.4% |
| Immigrants | Cabo Verde | 0.1 /100 | #304 | Tragic 11.3% |
| Immigrants | Latin America | 0.0 /100 | #305 | Tragic 11.3% |
| Mexican American Indians | 0.0 /100 | #306 | Tragic 11.2% |
| Cheyenne | 0.0 /100 | #307 | Tragic 11.2% |
| Puerto Ricans | 0.0 /100 | #308 | Tragic 11.2% |
| Puget Sound Salish | 0.0 /100 | #309 | Tragic 11.1% |
| Shoshone | 0.0 /100 | #310 | Tragic 11.1% |