White/Caucasian vs Immigrants from Laos Master's Degree
COMPARE
White/Caucasian
Immigrants from Laos
Master's Degree
Master's Degree Comparison
Whites/Caucasians
Immigrants from Laos
13.8%
MASTER'S DEGREE
9.1/ 100
METRIC RATING
228th/ 347
METRIC RANK
11.4%
MASTER'S DEGREE
0.1/ 100
METRIC RATING
303rd/ 347
METRIC RANK
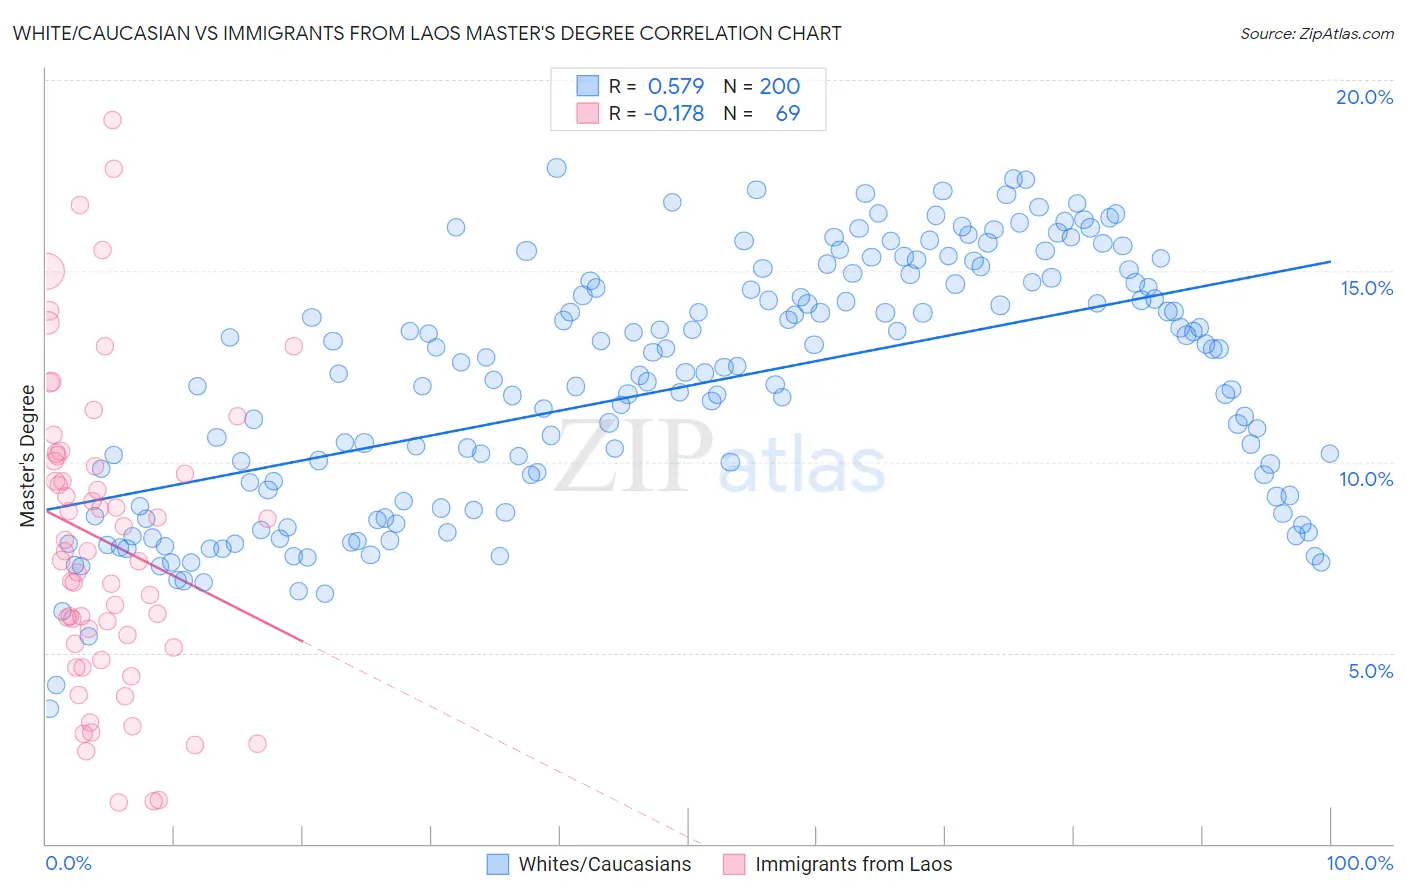
White/Caucasian vs Immigrants from Laos Master's Degree Correlation Chart
The statistical analysis conducted on geographies consisting of 583,022,214 people shows a substantial positive correlation between the proportion of Whites/Caucasians and percentage of population with at least master's degree education in the United States with a correlation coefficient (R) of 0.579 and weighted average of 13.8%. Similarly, the statistical analysis conducted on geographies consisting of 201,443,895 people shows a poor negative correlation between the proportion of Immigrants from Laos and percentage of population with at least master's degree education in the United States with a correlation coefficient (R) of -0.178 and weighted average of 11.4%, a difference of 21.6%.
Master's Degree Correlation Summary
| Measurement | White/Caucasian | Immigrants from Laos |
| Minimum | 3.5% | 1.1% |
| Maximum | 17.7% | 18.9% |
| Range | 14.2% | 17.8% |
| Mean | 12.0% | 7.9% |
| Median | 12.3% | 7.7% |
| Interquartile 25% (IQ1) | 8.9% | 5.2% |
| Interquartile 75% (IQ3) | 14.7% | 10.1% |
| Interquartile Range (IQR) | 5.8% | 4.9% |
| Standard Deviation (Sample) | 3.2% | 4.0% |
| Standard Deviation (Population) | 3.2% | 4.0% |
Similar Demographics by Master's Degree
Demographics Similar to Whites/Caucasians by Master's Degree
In terms of master's degree, the demographic groups most similar to Whites/Caucasians are British West Indian (13.8%, a difference of 0.10%), Dutch (13.8%, a difference of 0.14%), Immigrants from West Indies (13.9%, a difference of 0.31%), Guyanese (13.7%, a difference of 0.68%), and Immigrants from St. Vincent and the Grenadines (13.9%, a difference of 0.76%).
| Demographics | Rating | Rank | Master's Degree |
| Koreans | 12.7 /100 | #221 | Poor 14.0% |
| Ecuadorians | 12.6 /100 | #222 | Poor 14.0% |
| Immigrants | South Eastern Asia | 11.9 /100 | #223 | Poor 14.0% |
| Immigrants | Grenada | 11.8 /100 | #224 | Poor 14.0% |
| Portuguese | 11.2 /100 | #225 | Poor 13.9% |
| Immigrants | St. Vincent and the Grenadines | 11.0 /100 | #226 | Poor 13.9% |
| Immigrants | West Indies | 9.8 /100 | #227 | Tragic 13.9% |
| Whites/Caucasians | 9.1 /100 | #228 | Tragic 13.8% |
| British West Indians | 8.8 /100 | #229 | Tragic 13.8% |
| Dutch | 8.7 /100 | #230 | Tragic 13.8% |
| Guyanese | 7.6 /100 | #231 | Tragic 13.7% |
| Immigrants | Philippines | 6.0 /100 | #232 | Tragic 13.6% |
| Immigrants | Ecuador | 5.7 /100 | #233 | Tragic 13.6% |
| Immigrants | Burma/Myanmar | 5.0 /100 | #234 | Tragic 13.5% |
| German Russians | 4.5 /100 | #235 | Tragic 13.5% |
Demographics Similar to Immigrants from Laos by Master's Degree
In terms of master's degree, the demographic groups most similar to Immigrants from Laos are Cherokee (11.4%, a difference of 0.020%), Immigrants from Cabo Verde (11.3%, a difference of 0.19%), Tsimshian (11.4%, a difference of 0.33%), Chippewa (11.4%, a difference of 0.49%), and Chickasaw (11.4%, a difference of 0.51%).
| Demographics | Rating | Rank | Master's Degree |
| Alaskan Athabascans | 0.1 /100 | #296 | Tragic 11.6% |
| Immigrants | Yemen | 0.1 /100 | #297 | Tragic 11.6% |
| Samoans | 0.1 /100 | #298 | Tragic 11.5% |
| Chickasaw | 0.1 /100 | #299 | Tragic 11.4% |
| Chippewa | 0.1 /100 | #300 | Tragic 11.4% |
| Tsimshian | 0.1 /100 | #301 | Tragic 11.4% |
| Cherokee | 0.1 /100 | #302 | Tragic 11.4% |
| Immigrants | Laos | 0.1 /100 | #303 | Tragic 11.4% |
| Immigrants | Cabo Verde | 0.1 /100 | #304 | Tragic 11.3% |
| Immigrants | Latin America | 0.0 /100 | #305 | Tragic 11.3% |
| Mexican American Indians | 0.0 /100 | #306 | Tragic 11.2% |
| Cheyenne | 0.0 /100 | #307 | Tragic 11.2% |
| Puerto Ricans | 0.0 /100 | #308 | Tragic 11.2% |
| Puget Sound Salish | 0.0 /100 | #309 | Tragic 11.1% |
| Shoshone | 0.0 /100 | #310 | Tragic 11.1% |