Senegalese vs Immigrants from Sierra Leone Master's Degree
COMPARE
Senegalese
Immigrants from Sierra Leone
Master's Degree
Master's Degree Comparison
Senegalese
Immigrants from Sierra Leone
15.2%
MASTER'S DEGREE
65.6/ 100
METRIC RATING
167th/ 347
METRIC RANK
16.3%
MASTER'S DEGREE
94.7/ 100
METRIC RATING
128th/ 347
METRIC RANK
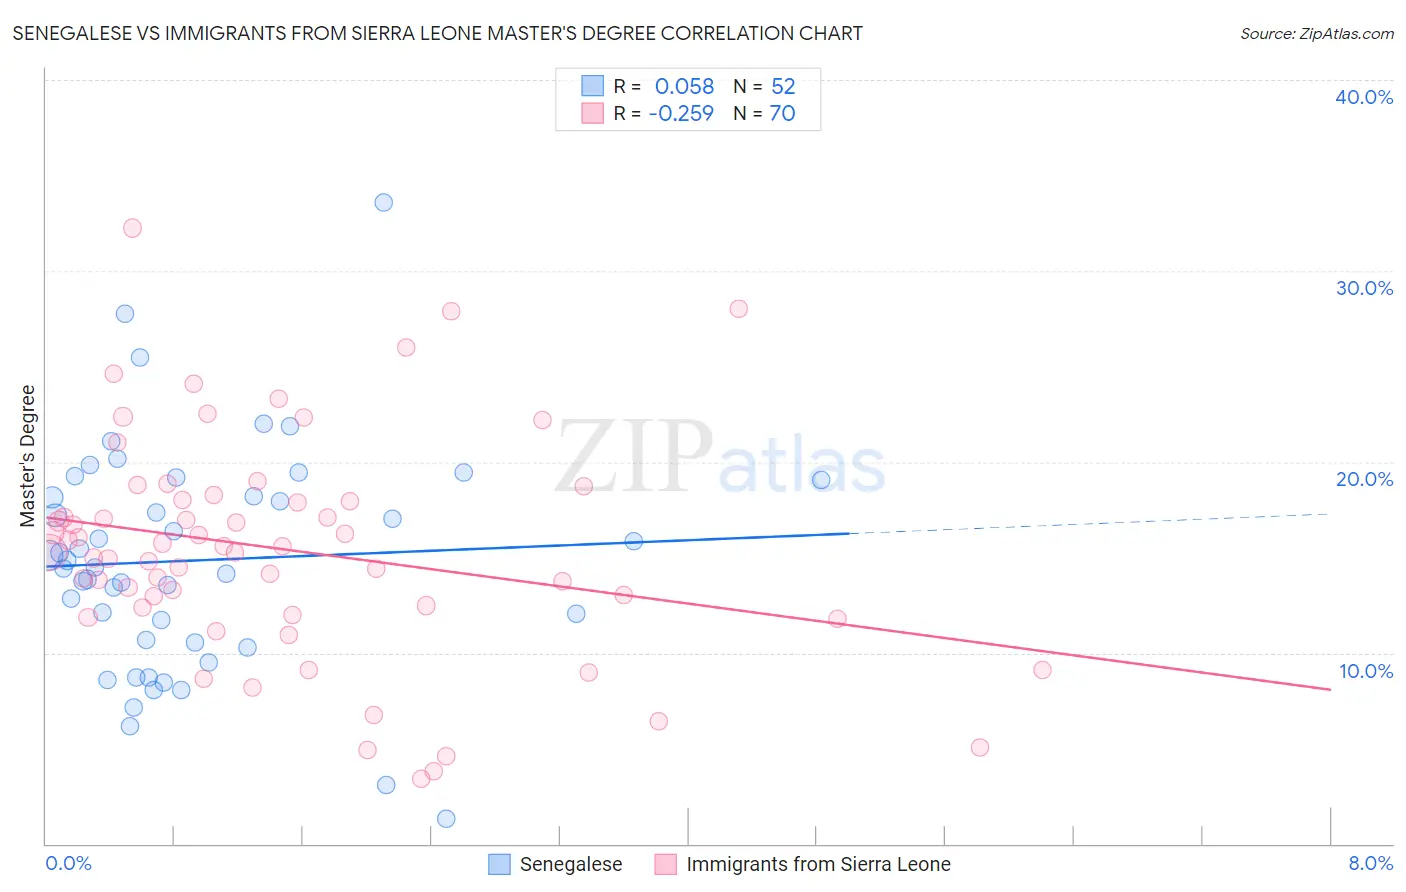
Senegalese vs Immigrants from Sierra Leone Master's Degree Correlation Chart
The statistical analysis conducted on geographies consisting of 78,095,521 people shows a slight positive correlation between the proportion of Senegalese and percentage of population with at least master's degree education in the United States with a correlation coefficient (R) of 0.058 and weighted average of 15.2%. Similarly, the statistical analysis conducted on geographies consisting of 101,623,305 people shows a weak negative correlation between the proportion of Immigrants from Sierra Leone and percentage of population with at least master's degree education in the United States with a correlation coefficient (R) of -0.259 and weighted average of 16.3%, a difference of 7.0%.
Master's Degree Correlation Summary
| Measurement | Senegalese | Immigrants from Sierra Leone |
| Minimum | 1.3% | 3.4% |
| Maximum | 33.6% | 32.2% |
| Range | 32.3% | 28.9% |
| Mean | 14.8% | 15.4% |
| Median | 14.7% | 15.4% |
| Interquartile 25% (IQ1) | 10.6% | 12.4% |
| Interquartile 75% (IQ3) | 18.6% | 18.0% |
| Interquartile Range (IQR) | 8.0% | 5.6% |
| Standard Deviation (Sample) | 5.9% | 5.9% |
| Standard Deviation (Population) | 5.9% | 5.8% |
Similar Demographics by Master's Degree
Demographics Similar to Senegalese by Master's Degree
In terms of master's degree, the demographic groups most similar to Senegalese are Swedish (15.2%, a difference of 0.070%), Immigrants from North Macedonia (15.2%, a difference of 0.14%), Immigrants from Kenya (15.3%, a difference of 0.15%), Colombian (15.3%, a difference of 0.19%), and Uruguayan (15.3%, a difference of 0.21%).
| Demographics | Rating | Rank | Master's Degree |
| Kenyans | 70.3 /100 | #160 | Good 15.3% |
| Sudanese | 68.7 /100 | #161 | Good 15.3% |
| Peruvians | 68.7 /100 | #162 | Good 15.3% |
| Uruguayans | 67.1 /100 | #163 | Good 15.3% |
| Colombians | 66.9 /100 | #164 | Good 15.3% |
| Immigrants | Kenya | 66.6 /100 | #165 | Good 15.3% |
| Swedes | 66.1 /100 | #166 | Good 15.2% |
| Senegalese | 65.6 /100 | #167 | Good 15.2% |
| Immigrants | North Macedonia | 64.5 /100 | #168 | Good 15.2% |
| Scottish | 62.7 /100 | #169 | Good 15.2% |
| Irish | 56.3 /100 | #170 | Average 15.0% |
| Immigrants | Ghana | 53.6 /100 | #171 | Average 15.0% |
| Immigrants | Uruguay | 52.8 /100 | #172 | Average 15.0% |
| Costa Ricans | 52.5 /100 | #173 | Average 15.0% |
| Slovaks | 50.0 /100 | #174 | Average 14.9% |
Demographics Similar to Immigrants from Sierra Leone by Master's Degree
In terms of master's degree, the demographic groups most similar to Immigrants from Sierra Leone are Palestinian (16.3%, a difference of 0.050%), Immigrants from Eastern Africa (16.3%, a difference of 0.31%), Italian (16.4%, a difference of 0.42%), Immigrants from Eritrea (16.4%, a difference of 0.50%), and Croatian (16.4%, a difference of 0.57%).
| Demographics | Rating | Rank | Master's Degree |
| Afghans | 96.2 /100 | #121 | Exceptional 16.5% |
| British | 95.6 /100 | #122 | Exceptional 16.4% |
| Croatians | 95.6 /100 | #123 | Exceptional 16.4% |
| Immigrants | Eritrea | 95.5 /100 | #124 | Exceptional 16.4% |
| Italians | 95.4 /100 | #125 | Exceptional 16.4% |
| Immigrants | Eastern Africa | 95.2 /100 | #126 | Exceptional 16.3% |
| Palestinians | 94.8 /100 | #127 | Exceptional 16.3% |
| Immigrants | Sierra Leone | 94.7 /100 | #128 | Exceptional 16.3% |
| Immigrants | Syria | 93.3 /100 | #129 | Exceptional 16.2% |
| Immigrants | Jordan | 92.7 /100 | #130 | Exceptional 16.1% |
| Taiwanese | 91.9 /100 | #131 | Exceptional 16.1% |
| Serbians | 91.7 /100 | #132 | Exceptional 16.1% |
| Immigrants | Sudan | 90.2 /100 | #133 | Exceptional 16.0% |
| Venezuelans | 88.4 /100 | #134 | Excellent 15.9% |
| South American Indians | 88.4 /100 | #135 | Excellent 15.9% |