Senegalese vs Immigrants from Hong Kong Master's Degree
COMPARE
Senegalese
Immigrants from Hong Kong
Master's Degree
Master's Degree Comparison
Senegalese
Immigrants from Hong Kong
15.2%
MASTER'S DEGREE
65.6/ 100
METRIC RATING
167th/ 347
METRIC RANK
20.5%
MASTER'S DEGREE
100.0/ 100
METRIC RATING
19th/ 347
METRIC RANK
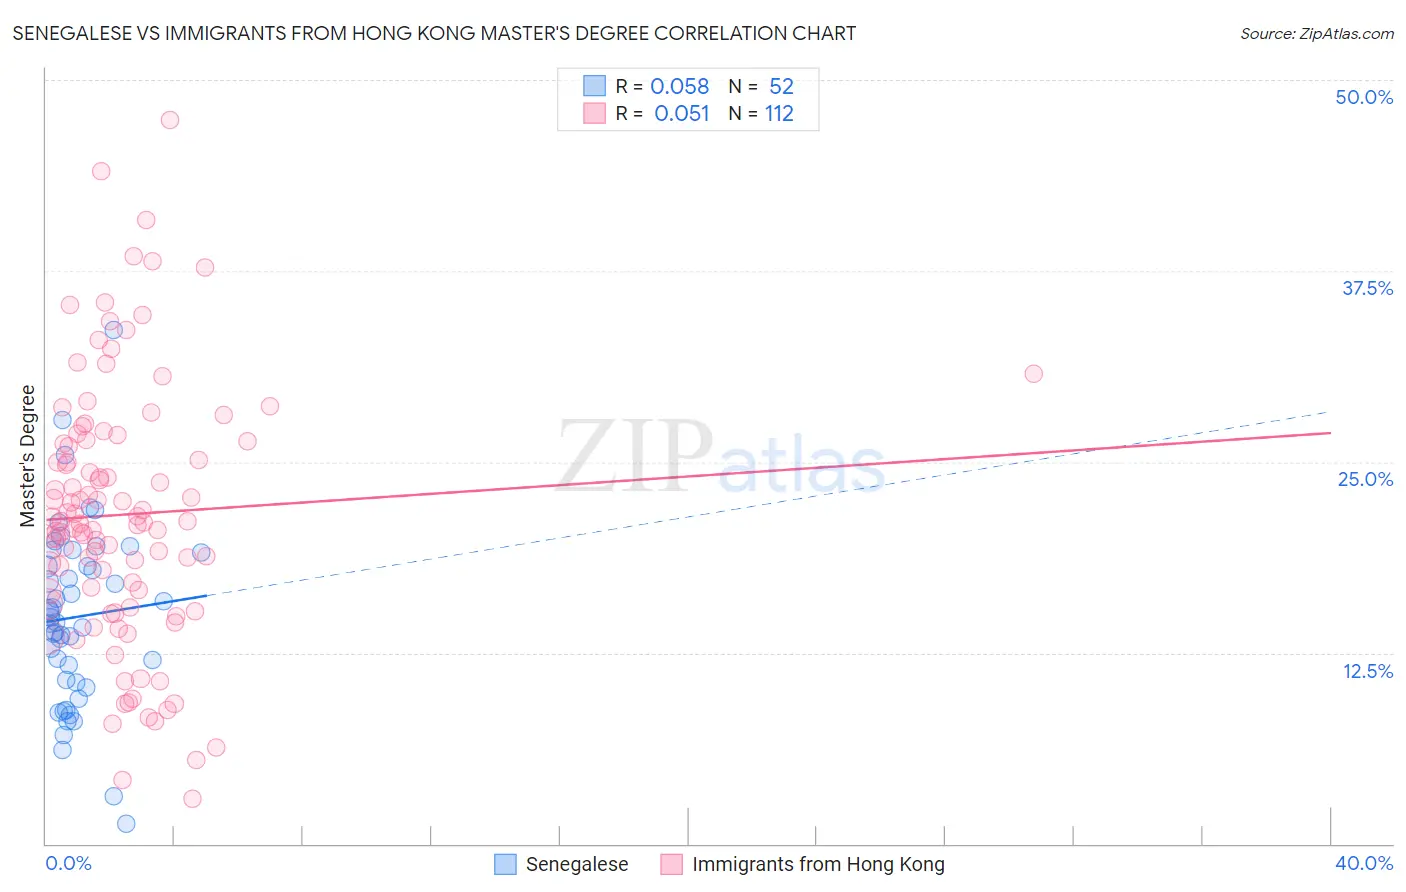
Senegalese vs Immigrants from Hong Kong Master's Degree Correlation Chart
The statistical analysis conducted on geographies consisting of 78,095,521 people shows a slight positive correlation between the proportion of Senegalese and percentage of population with at least master's degree education in the United States with a correlation coefficient (R) of 0.058 and weighted average of 15.2%. Similarly, the statistical analysis conducted on geographies consisting of 253,947,811 people shows a slight positive correlation between the proportion of Immigrants from Hong Kong and percentage of population with at least master's degree education in the United States with a correlation coefficient (R) of 0.051 and weighted average of 20.5%, a difference of 34.3%.
Master's Degree Correlation Summary
| Measurement | Senegalese | Immigrants from Hong Kong |
| Minimum | 1.3% | 2.9% |
| Maximum | 33.6% | 47.4% |
| Range | 32.3% | 44.5% |
| Mean | 14.8% | 21.6% |
| Median | 14.7% | 21.1% |
| Interquartile 25% (IQ1) | 10.6% | 16.1% |
| Interquartile 75% (IQ3) | 18.6% | 26.4% |
| Interquartile Range (IQR) | 8.0% | 10.3% |
| Standard Deviation (Sample) | 5.9% | 8.5% |
| Standard Deviation (Population) | 5.9% | 8.5% |
Similar Demographics by Master's Degree
Demographics Similar to Senegalese by Master's Degree
In terms of master's degree, the demographic groups most similar to Senegalese are Swedish (15.2%, a difference of 0.070%), Immigrants from North Macedonia (15.2%, a difference of 0.14%), Immigrants from Kenya (15.3%, a difference of 0.15%), Colombian (15.3%, a difference of 0.19%), and Uruguayan (15.3%, a difference of 0.21%).
| Demographics | Rating | Rank | Master's Degree |
| Kenyans | 70.3 /100 | #160 | Good 15.3% |
| Sudanese | 68.7 /100 | #161 | Good 15.3% |
| Peruvians | 68.7 /100 | #162 | Good 15.3% |
| Uruguayans | 67.1 /100 | #163 | Good 15.3% |
| Colombians | 66.9 /100 | #164 | Good 15.3% |
| Immigrants | Kenya | 66.6 /100 | #165 | Good 15.3% |
| Swedes | 66.1 /100 | #166 | Good 15.2% |
| Senegalese | 65.6 /100 | #167 | Good 15.2% |
| Immigrants | North Macedonia | 64.5 /100 | #168 | Good 15.2% |
| Scottish | 62.7 /100 | #169 | Good 15.2% |
| Irish | 56.3 /100 | #170 | Average 15.0% |
| Immigrants | Ghana | 53.6 /100 | #171 | Average 15.0% |
| Immigrants | Uruguay | 52.8 /100 | #172 | Average 15.0% |
| Costa Ricans | 52.5 /100 | #173 | Average 15.0% |
| Slovaks | 50.0 /100 | #174 | Average 14.9% |
Demographics Similar to Immigrants from Hong Kong by Master's Degree
In terms of master's degree, the demographic groups most similar to Immigrants from Hong Kong are Indian (Asian) (20.5%, a difference of 0.020%), Immigrants from Ireland (20.4%, a difference of 0.13%), Soviet Union (20.5%, a difference of 0.35%), Israeli (20.3%, a difference of 0.55%), and Immigrants from France (20.3%, a difference of 0.83%).
| Demographics | Rating | Rank | Master's Degree |
| Eastern Europeans | 100.0 /100 | #12 | Exceptional 21.1% |
| Immigrants | Australia | 100.0 /100 | #13 | Exceptional 20.9% |
| Immigrants | Switzerland | 100.0 /100 | #14 | Exceptional 20.9% |
| Immigrants | Eastern Asia | 100.0 /100 | #15 | Exceptional 20.8% |
| Immigrants | Belgium | 100.0 /100 | #16 | Exceptional 20.8% |
| Immigrants | South Central Asia | 100.0 /100 | #17 | Exceptional 20.7% |
| Soviet Union | 100.0 /100 | #18 | Exceptional 20.5% |
| Immigrants | Hong Kong | 100.0 /100 | #19 | Exceptional 20.5% |
| Indians (Asian) | 100.0 /100 | #20 | Exceptional 20.5% |
| Immigrants | Ireland | 100.0 /100 | #21 | Exceptional 20.4% |
| Israelis | 100.0 /100 | #22 | Exceptional 20.3% |
| Immigrants | France | 100.0 /100 | #23 | Exceptional 20.3% |
| Immigrants | Sweden | 100.0 /100 | #24 | Exceptional 20.3% |
| Immigrants | Japan | 100.0 /100 | #25 | Exceptional 20.0% |
| Cambodians | 100.0 /100 | #26 | Exceptional 20.0% |