Thai vs Immigrants from Laos Master's Degree
COMPARE
Thai
Immigrants from Laos
Master's Degree
Master's Degree Comparison
Thais
Immigrants from Laos
21.7%
MASTER'S DEGREE
100.0/ 100
METRIC RATING
9th/ 347
METRIC RANK
11.4%
MASTER'S DEGREE
0.1/ 100
METRIC RATING
303rd/ 347
METRIC RANK
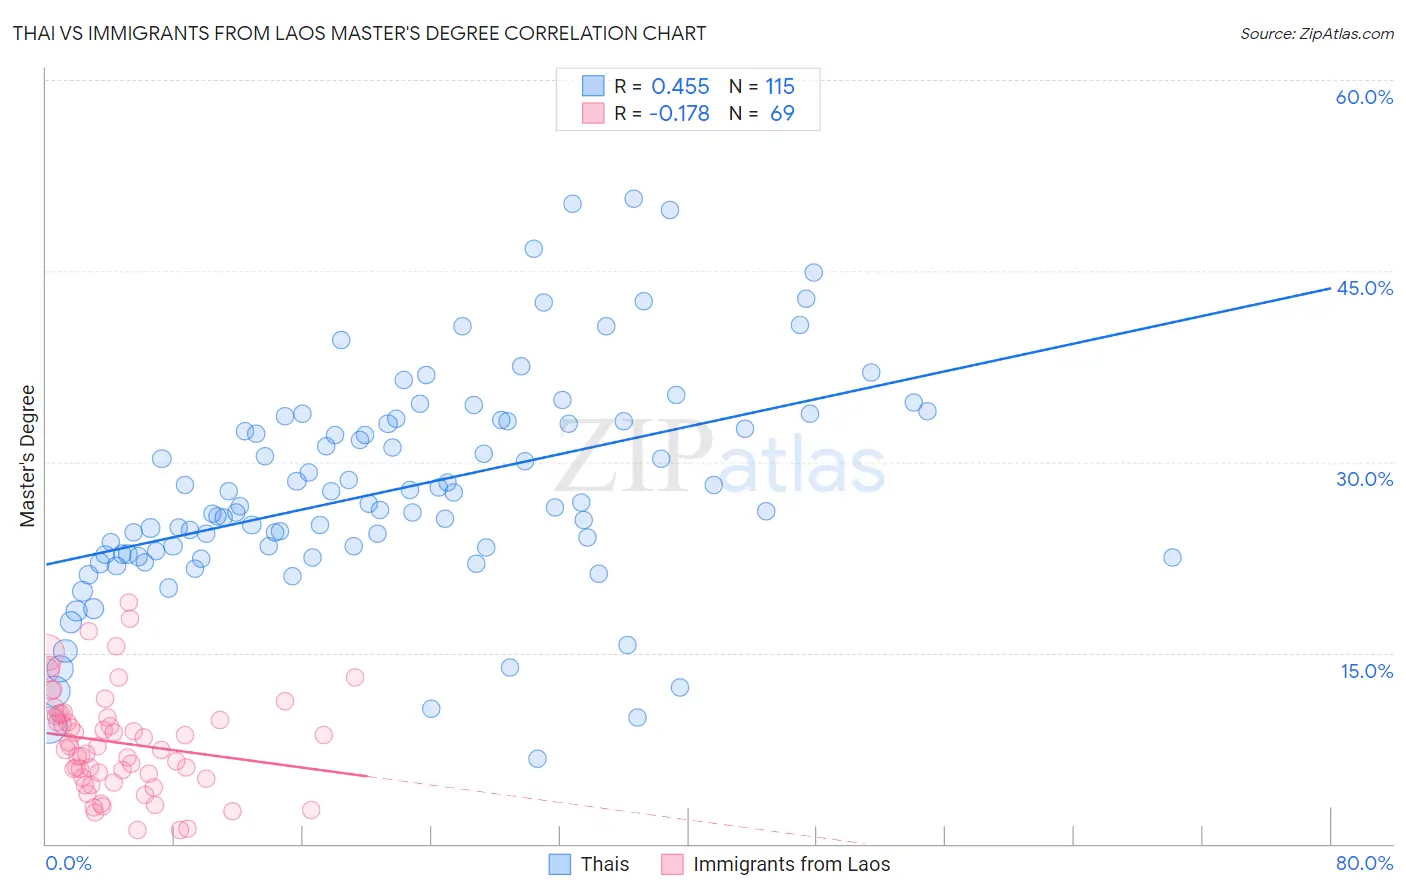
Thai vs Immigrants from Laos Master's Degree Correlation Chart
The statistical analysis conducted on geographies consisting of 475,625,937 people shows a moderate positive correlation between the proportion of Thais and percentage of population with at least master's degree education in the United States with a correlation coefficient (R) of 0.455 and weighted average of 21.7%. Similarly, the statistical analysis conducted on geographies consisting of 201,443,895 people shows a poor negative correlation between the proportion of Immigrants from Laos and percentage of population with at least master's degree education in the United States with a correlation coefficient (R) of -0.178 and weighted average of 11.4%, a difference of 91.1%.
Master's Degree Correlation Summary
| Measurement | Thai | Immigrants from Laos |
| Minimum | 6.7% | 1.1% |
| Maximum | 50.7% | 18.9% |
| Range | 44.0% | 17.8% |
| Mean | 27.8% | 7.9% |
| Median | 26.5% | 7.7% |
| Interquartile 25% (IQ1) | 22.7% | 5.2% |
| Interquartile 75% (IQ3) | 33.2% | 10.1% |
| Interquartile Range (IQR) | 10.4% | 4.9% |
| Standard Deviation (Sample) | 8.5% | 4.0% |
| Standard Deviation (Population) | 8.5% | 4.0% |
Similar Demographics by Master's Degree
Demographics Similar to Thais by Master's Degree
In terms of master's degree, the demographic groups most similar to Thais are Cypriot (21.8%, a difference of 0.34%), Immigrants from Iran (21.6%, a difference of 0.41%), Immigrants from China (21.2%, a difference of 2.5%), Iranian (22.3%, a difference of 2.5%), and Immigrants from India (22.3%, a difference of 2.8%).
| Demographics | Rating | Rank | Master's Degree |
| Filipinos | 100.0 /100 | #2 | Exceptional 23.4% |
| Immigrants | Israel | 100.0 /100 | #3 | Exceptional 22.6% |
| Okinawans | 100.0 /100 | #4 | Exceptional 22.6% |
| Immigrants | Taiwan | 100.0 /100 | #5 | Exceptional 22.5% |
| Immigrants | India | 100.0 /100 | #6 | Exceptional 22.3% |
| Iranians | 100.0 /100 | #7 | Exceptional 22.3% |
| Cypriots | 100.0 /100 | #8 | Exceptional 21.8% |
| Thais | 100.0 /100 | #9 | Exceptional 21.7% |
| Immigrants | Iran | 100.0 /100 | #10 | Exceptional 21.6% |
| Immigrants | China | 100.0 /100 | #11 | Exceptional 21.2% |
| Eastern Europeans | 100.0 /100 | #12 | Exceptional 21.1% |
| Immigrants | Australia | 100.0 /100 | #13 | Exceptional 20.9% |
| Immigrants | Switzerland | 100.0 /100 | #14 | Exceptional 20.9% |
| Immigrants | Eastern Asia | 100.0 /100 | #15 | Exceptional 20.8% |
| Immigrants | Belgium | 100.0 /100 | #16 | Exceptional 20.8% |
Demographics Similar to Immigrants from Laos by Master's Degree
In terms of master's degree, the demographic groups most similar to Immigrants from Laos are Cherokee (11.4%, a difference of 0.020%), Immigrants from Cabo Verde (11.3%, a difference of 0.19%), Tsimshian (11.4%, a difference of 0.33%), Chippewa (11.4%, a difference of 0.49%), and Chickasaw (11.4%, a difference of 0.51%).
| Demographics | Rating | Rank | Master's Degree |
| Alaskan Athabascans | 0.1 /100 | #296 | Tragic 11.6% |
| Immigrants | Yemen | 0.1 /100 | #297 | Tragic 11.6% |
| Samoans | 0.1 /100 | #298 | Tragic 11.5% |
| Chickasaw | 0.1 /100 | #299 | Tragic 11.4% |
| Chippewa | 0.1 /100 | #300 | Tragic 11.4% |
| Tsimshian | 0.1 /100 | #301 | Tragic 11.4% |
| Cherokee | 0.1 /100 | #302 | Tragic 11.4% |
| Immigrants | Laos | 0.1 /100 | #303 | Tragic 11.4% |
| Immigrants | Cabo Verde | 0.1 /100 | #304 | Tragic 11.3% |
| Immigrants | Latin America | 0.0 /100 | #305 | Tragic 11.3% |
| Mexican American Indians | 0.0 /100 | #306 | Tragic 11.2% |
| Cheyenne | 0.0 /100 | #307 | Tragic 11.2% |
| Puerto Ricans | 0.0 /100 | #308 | Tragic 11.2% |
| Puget Sound Salish | 0.0 /100 | #309 | Tragic 11.1% |
| Shoshone | 0.0 /100 | #310 | Tragic 11.1% |