Senegalese vs Delaware Master's Degree
COMPARE
Senegalese
Delaware
Master's Degree
Master's Degree Comparison
Senegalese
Delaware
15.2%
MASTER'S DEGREE
65.6/ 100
METRIC RATING
167th/ 347
METRIC RANK
13.0%
MASTER'S DEGREE
1.7/ 100
METRIC RATING
244th/ 347
METRIC RANK
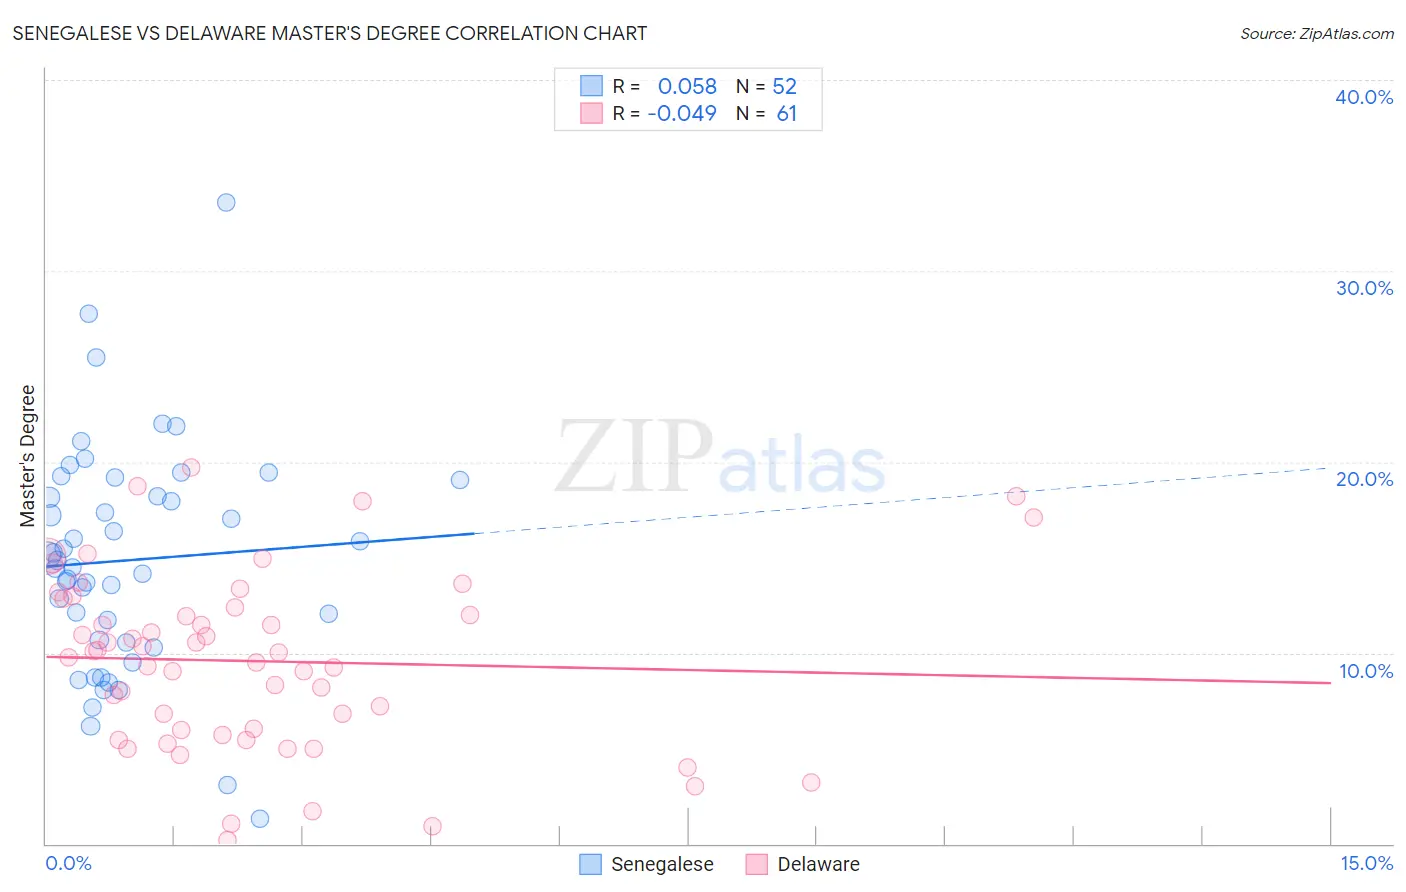
Senegalese vs Delaware Master's Degree Correlation Chart
The statistical analysis conducted on geographies consisting of 78,095,521 people shows a slight positive correlation between the proportion of Senegalese and percentage of population with at least master's degree education in the United States with a correlation coefficient (R) of 0.058 and weighted average of 15.2%. Similarly, the statistical analysis conducted on geographies consisting of 96,222,112 people shows no correlation between the proportion of Delaware and percentage of population with at least master's degree education in the United States with a correlation coefficient (R) of -0.049 and weighted average of 13.0%, a difference of 17.2%.
Master's Degree Correlation Summary
| Measurement | Senegalese | Delaware |
| Minimum | 1.3% | 0.20% |
| Maximum | 33.6% | 19.7% |
| Range | 32.3% | 19.5% |
| Mean | 14.8% | 9.6% |
| Median | 14.7% | 10.0% |
| Interquartile 25% (IQ1) | 10.6% | 5.8% |
| Interquartile 75% (IQ3) | 18.6% | 12.6% |
| Interquartile Range (IQR) | 8.0% | 6.8% |
| Standard Deviation (Sample) | 5.9% | 4.6% |
| Standard Deviation (Population) | 5.9% | 4.5% |
Similar Demographics by Master's Degree
Demographics Similar to Senegalese by Master's Degree
In terms of master's degree, the demographic groups most similar to Senegalese are Swedish (15.2%, a difference of 0.070%), Immigrants from North Macedonia (15.2%, a difference of 0.14%), Immigrants from Kenya (15.3%, a difference of 0.15%), Colombian (15.3%, a difference of 0.19%), and Uruguayan (15.3%, a difference of 0.21%).
| Demographics | Rating | Rank | Master's Degree |
| Kenyans | 70.3 /100 | #160 | Good 15.3% |
| Sudanese | 68.7 /100 | #161 | Good 15.3% |
| Peruvians | 68.7 /100 | #162 | Good 15.3% |
| Uruguayans | 67.1 /100 | #163 | Good 15.3% |
| Colombians | 66.9 /100 | #164 | Good 15.3% |
| Immigrants | Kenya | 66.6 /100 | #165 | Good 15.3% |
| Swedes | 66.1 /100 | #166 | Good 15.2% |
| Senegalese | 65.6 /100 | #167 | Good 15.2% |
| Immigrants | North Macedonia | 64.5 /100 | #168 | Good 15.2% |
| Scottish | 62.7 /100 | #169 | Good 15.2% |
| Irish | 56.3 /100 | #170 | Average 15.0% |
| Immigrants | Ghana | 53.6 /100 | #171 | Average 15.0% |
| Immigrants | Uruguay | 52.8 /100 | #172 | Average 15.0% |
| Costa Ricans | 52.5 /100 | #173 | Average 15.0% |
| Slovaks | 50.0 /100 | #174 | Average 14.9% |
Demographics Similar to Delaware by Master's Degree
In terms of master's degree, the demographic groups most similar to Delaware are Immigrants from Jamaica (13.0%, a difference of 0.38%), Spanish American (13.0%, a difference of 0.42%), Immigrants from Bahamas (12.9%, a difference of 0.66%), U.S. Virgin Islander (13.1%, a difference of 0.70%), and Immigrants from Cambodia (12.9%, a difference of 0.70%).
| Demographics | Rating | Rank | Master's Degree |
| Jamaicans | 4.1 /100 | #237 | Tragic 13.4% |
| Hmong | 4.0 /100 | #238 | Tragic 13.4% |
| Immigrants | Nonimmigrants | 3.4 /100 | #239 | Tragic 13.3% |
| Guamanians/Chamorros | 2.2 /100 | #240 | Tragic 13.1% |
| U.S. Virgin Islanders | 2.1 /100 | #241 | Tragic 13.1% |
| Spanish Americans | 1.9 /100 | #242 | Tragic 13.0% |
| Immigrants | Jamaica | 1.9 /100 | #243 | Tragic 13.0% |
| Delaware | 1.7 /100 | #244 | Tragic 13.0% |
| Immigrants | Bahamas | 1.4 /100 | #245 | Tragic 12.9% |
| Immigrants | Cambodia | 1.4 /100 | #246 | Tragic 12.9% |
| Iroquois | 1.4 /100 | #247 | Tragic 12.9% |
| Africans | 1.4 /100 | #248 | Tragic 12.9% |
| Cree | 1.3 /100 | #249 | Tragic 12.8% |
| Liberians | 1.3 /100 | #250 | Tragic 12.8% |
| Tlingit-Haida | 1.3 /100 | #251 | Tragic 12.8% |