Senegalese vs Irish Master's Degree
COMPARE
Senegalese
Irish
Master's Degree
Master's Degree Comparison
Senegalese
Irish
15.2%
MASTER'S DEGREE
65.6/ 100
METRIC RATING
167th/ 347
METRIC RANK
15.0%
MASTER'S DEGREE
56.3/ 100
METRIC RATING
170th/ 347
METRIC RANK
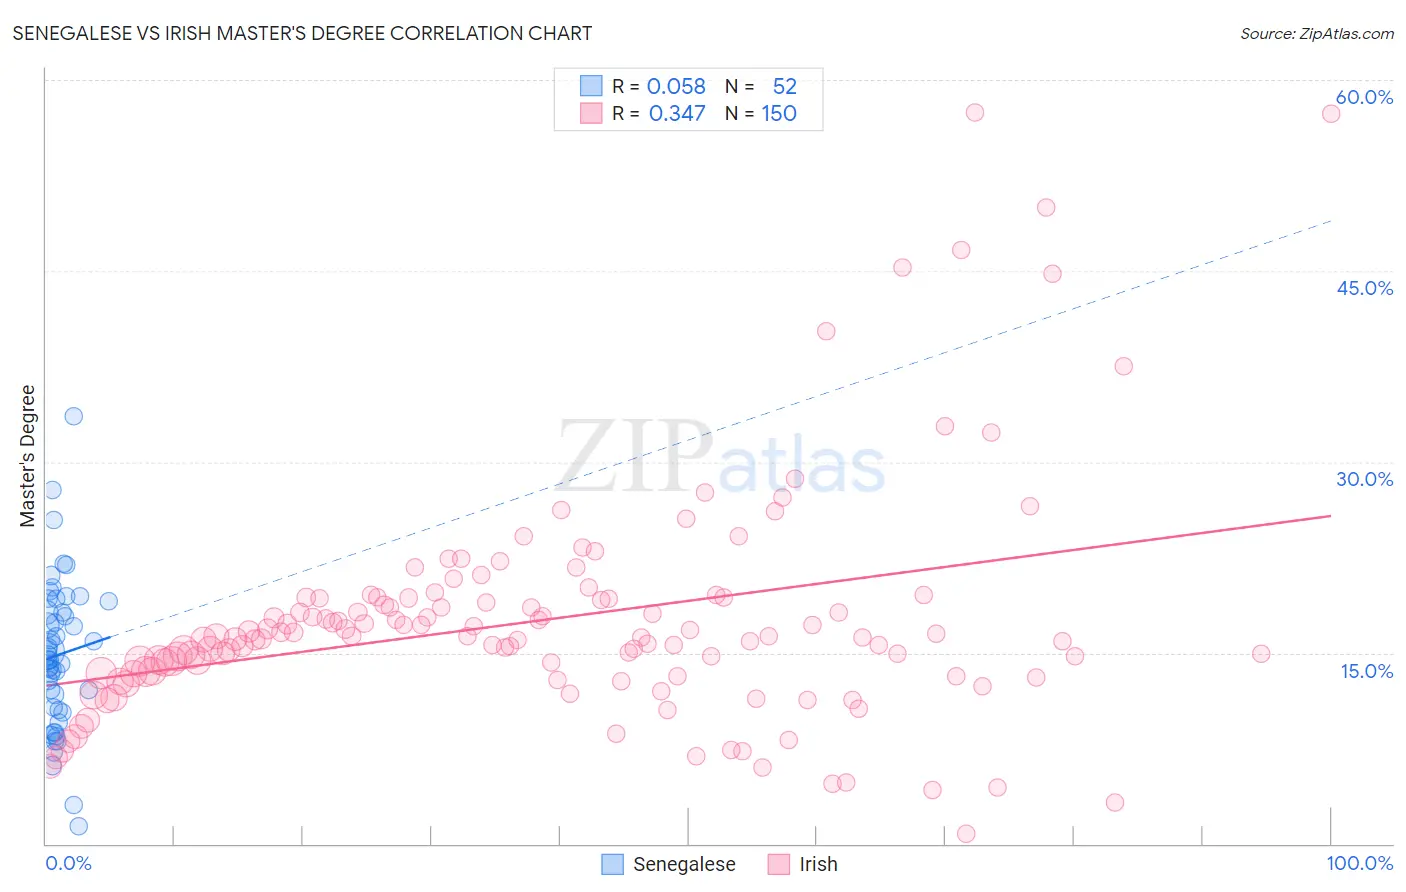
Senegalese vs Irish Master's Degree Correlation Chart
The statistical analysis conducted on geographies consisting of 78,095,521 people shows a slight positive correlation between the proportion of Senegalese and percentage of population with at least master's degree education in the United States with a correlation coefficient (R) of 0.058 and weighted average of 15.2%. Similarly, the statistical analysis conducted on geographies consisting of 579,087,481 people shows a mild positive correlation between the proportion of Irish and percentage of population with at least master's degree education in the United States with a correlation coefficient (R) of 0.347 and weighted average of 15.0%, a difference of 1.2%.
Master's Degree Correlation Summary
| Measurement | Senegalese | Irish |
| Minimum | 1.3% | 0.78% |
| Maximum | 33.6% | 57.5% |
| Range | 32.3% | 56.7% |
| Mean | 14.8% | 17.6% |
| Median | 14.7% | 16.3% |
| Interquartile 25% (IQ1) | 10.6% | 13.4% |
| Interquartile 75% (IQ3) | 18.6% | 19.3% |
| Interquartile Range (IQR) | 8.0% | 5.9% |
| Standard Deviation (Sample) | 5.9% | 9.0% |
| Standard Deviation (Population) | 5.9% | 9.0% |
Demographics Similar to Senegalese and Irish by Master's Degree
In terms of master's degree, the demographic groups most similar to Senegalese are Swedish (15.2%, a difference of 0.070%), Immigrants from North Macedonia (15.2%, a difference of 0.14%), Immigrants from Kenya (15.3%, a difference of 0.15%), Colombian (15.3%, a difference of 0.19%), and Uruguayan (15.3%, a difference of 0.21%). Similarly, the demographic groups most similar to Irish are Immigrants from Ghana (15.0%, a difference of 0.35%), Immigrants from Uruguay (15.0%, a difference of 0.46%), Costa Rican (15.0%, a difference of 0.50%), Slovak (14.9%, a difference of 0.81%), and Scottish (15.2%, a difference of 0.84%).
| Demographics | Rating | Rank | Master's Degree |
| Immigrants | Poland | 71.5 /100 | #158 | Good 15.4% |
| Luxembourgers | 71.0 /100 | #159 | Good 15.3% |
| Kenyans | 70.3 /100 | #160 | Good 15.3% |
| Sudanese | 68.7 /100 | #161 | Good 15.3% |
| Peruvians | 68.7 /100 | #162 | Good 15.3% |
| Uruguayans | 67.1 /100 | #163 | Good 15.3% |
| Colombians | 66.9 /100 | #164 | Good 15.3% |
| Immigrants | Kenya | 66.6 /100 | #165 | Good 15.3% |
| Swedes | 66.1 /100 | #166 | Good 15.2% |
| Senegalese | 65.6 /100 | #167 | Good 15.2% |
| Immigrants | North Macedonia | 64.5 /100 | #168 | Good 15.2% |
| Scottish | 62.7 /100 | #169 | Good 15.2% |
| Irish | 56.3 /100 | #170 | Average 15.0% |
| Immigrants | Ghana | 53.6 /100 | #171 | Average 15.0% |
| Immigrants | Uruguay | 52.8 /100 | #172 | Average 15.0% |
| Costa Ricans | 52.5 /100 | #173 | Average 15.0% |
| Slovaks | 50.0 /100 | #174 | Average 14.9% |
| Immigrants | Peru | 49.6 /100 | #175 | Average 14.9% |
| Nigerians | 48.6 /100 | #176 | Average 14.9% |
| Immigrants | Colombia | 48.3 /100 | #177 | Average 14.9% |
| English | 45.0 /100 | #178 | Average 14.8% |