Senegalese vs Immigrants from Portugal Master's Degree
COMPARE
Senegalese
Immigrants from Portugal
Master's Degree
Master's Degree Comparison
Senegalese
Immigrants from Portugal
15.2%
MASTER'S DEGREE
65.6/ 100
METRIC RATING
167th/ 347
METRIC RANK
12.6%
MASTER'S DEGREE
0.8/ 100
METRIC RATING
256th/ 347
METRIC RANK
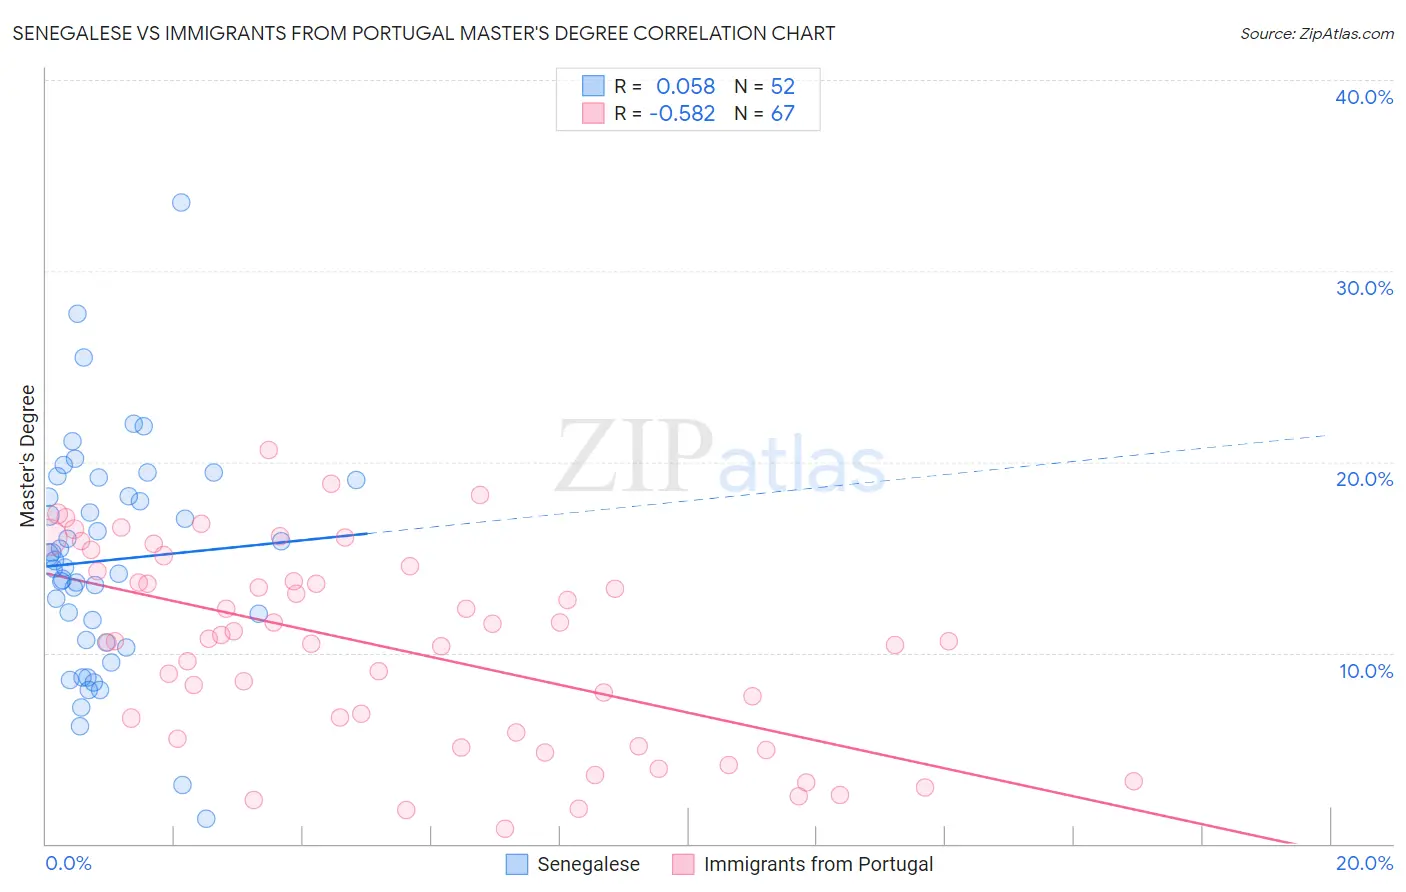
Senegalese vs Immigrants from Portugal Master's Degree Correlation Chart
The statistical analysis conducted on geographies consisting of 78,095,521 people shows a slight positive correlation between the proportion of Senegalese and percentage of population with at least master's degree education in the United States with a correlation coefficient (R) of 0.058 and weighted average of 15.2%. Similarly, the statistical analysis conducted on geographies consisting of 174,778,978 people shows a substantial negative correlation between the proportion of Immigrants from Portugal and percentage of population with at least master's degree education in the United States with a correlation coefficient (R) of -0.582 and weighted average of 12.6%, a difference of 20.6%.
Master's Degree Correlation Summary
| Measurement | Senegalese | Immigrants from Portugal |
| Minimum | 1.3% | 0.81% |
| Maximum | 33.6% | 20.6% |
| Range | 32.3% | 19.8% |
| Mean | 14.8% | 10.3% |
| Median | 14.7% | 10.6% |
| Interquartile 25% (IQ1) | 10.6% | 5.5% |
| Interquartile 75% (IQ3) | 18.6% | 14.3% |
| Interquartile Range (IQR) | 8.0% | 8.8% |
| Standard Deviation (Sample) | 5.9% | 5.1% |
| Standard Deviation (Population) | 5.9% | 5.1% |
Similar Demographics by Master's Degree
Demographics Similar to Senegalese by Master's Degree
In terms of master's degree, the demographic groups most similar to Senegalese are Swedish (15.2%, a difference of 0.070%), Immigrants from North Macedonia (15.2%, a difference of 0.14%), Immigrants from Kenya (15.3%, a difference of 0.15%), Colombian (15.3%, a difference of 0.19%), and Uruguayan (15.3%, a difference of 0.21%).
| Demographics | Rating | Rank | Master's Degree |
| Kenyans | 70.3 /100 | #160 | Good 15.3% |
| Sudanese | 68.7 /100 | #161 | Good 15.3% |
| Peruvians | 68.7 /100 | #162 | Good 15.3% |
| Uruguayans | 67.1 /100 | #163 | Good 15.3% |
| Colombians | 66.9 /100 | #164 | Good 15.3% |
| Immigrants | Kenya | 66.6 /100 | #165 | Good 15.3% |
| Swedes | 66.1 /100 | #166 | Good 15.2% |
| Senegalese | 65.6 /100 | #167 | Good 15.2% |
| Immigrants | North Macedonia | 64.5 /100 | #168 | Good 15.2% |
| Scottish | 62.7 /100 | #169 | Good 15.2% |
| Irish | 56.3 /100 | #170 | Average 15.0% |
| Immigrants | Ghana | 53.6 /100 | #171 | Average 15.0% |
| Immigrants | Uruguay | 52.8 /100 | #172 | Average 15.0% |
| Costa Ricans | 52.5 /100 | #173 | Average 15.0% |
| Slovaks | 50.0 /100 | #174 | Average 14.9% |
Demographics Similar to Immigrants from Portugal by Master's Degree
In terms of master's degree, the demographic groups most similar to Immigrants from Portugal are Immigrants from Congo (12.6%, a difference of 0.080%), Indonesian (12.6%, a difference of 0.10%), Immigrants from Dominica (12.6%, a difference of 0.14%), Osage (12.6%, a difference of 0.48%), and French American Indian (12.7%, a difference of 0.69%).
| Demographics | Rating | Rank | Master's Degree |
| Cree | 1.3 /100 | #249 | Tragic 12.8% |
| Liberians | 1.3 /100 | #250 | Tragic 12.8% |
| Tlingit-Haida | 1.3 /100 | #251 | Tragic 12.8% |
| French American Indians | 1.0 /100 | #252 | Tragic 12.7% |
| Immigrants | Dominica | 0.8 /100 | #253 | Tragic 12.6% |
| Indonesians | 0.8 /100 | #254 | Tragic 12.6% |
| Immigrants | Congo | 0.8 /100 | #255 | Tragic 12.6% |
| Immigrants | Portugal | 0.8 /100 | #256 | Tragic 12.6% |
| Osage | 0.7 /100 | #257 | Tragic 12.6% |
| Immigrants | Liberia | 0.6 /100 | #258 | Tragic 12.5% |
| Japanese | 0.6 /100 | #259 | Tragic 12.5% |
| Dominicans | 0.6 /100 | #260 | Tragic 12.5% |
| Tongans | 0.6 /100 | #261 | Tragic 12.5% |
| Nicaraguans | 0.6 /100 | #262 | Tragic 12.5% |
| Central American Indians | 0.5 /100 | #263 | Tragic 12.4% |