Slavic vs Subsaharan African High School Diploma
COMPARE
Slavic
Subsaharan African
High School Diploma
High School Diploma Comparison
Slavs
Sub-Saharan Africans
91.0%
HIGH SCHOOL DIPLOMA
99.7/ 100
METRIC RATING
58th/ 347
METRIC RANK
87.9%
HIGH SCHOOL DIPLOMA
2.8/ 100
METRIC RATING
236th/ 347
METRIC RANK
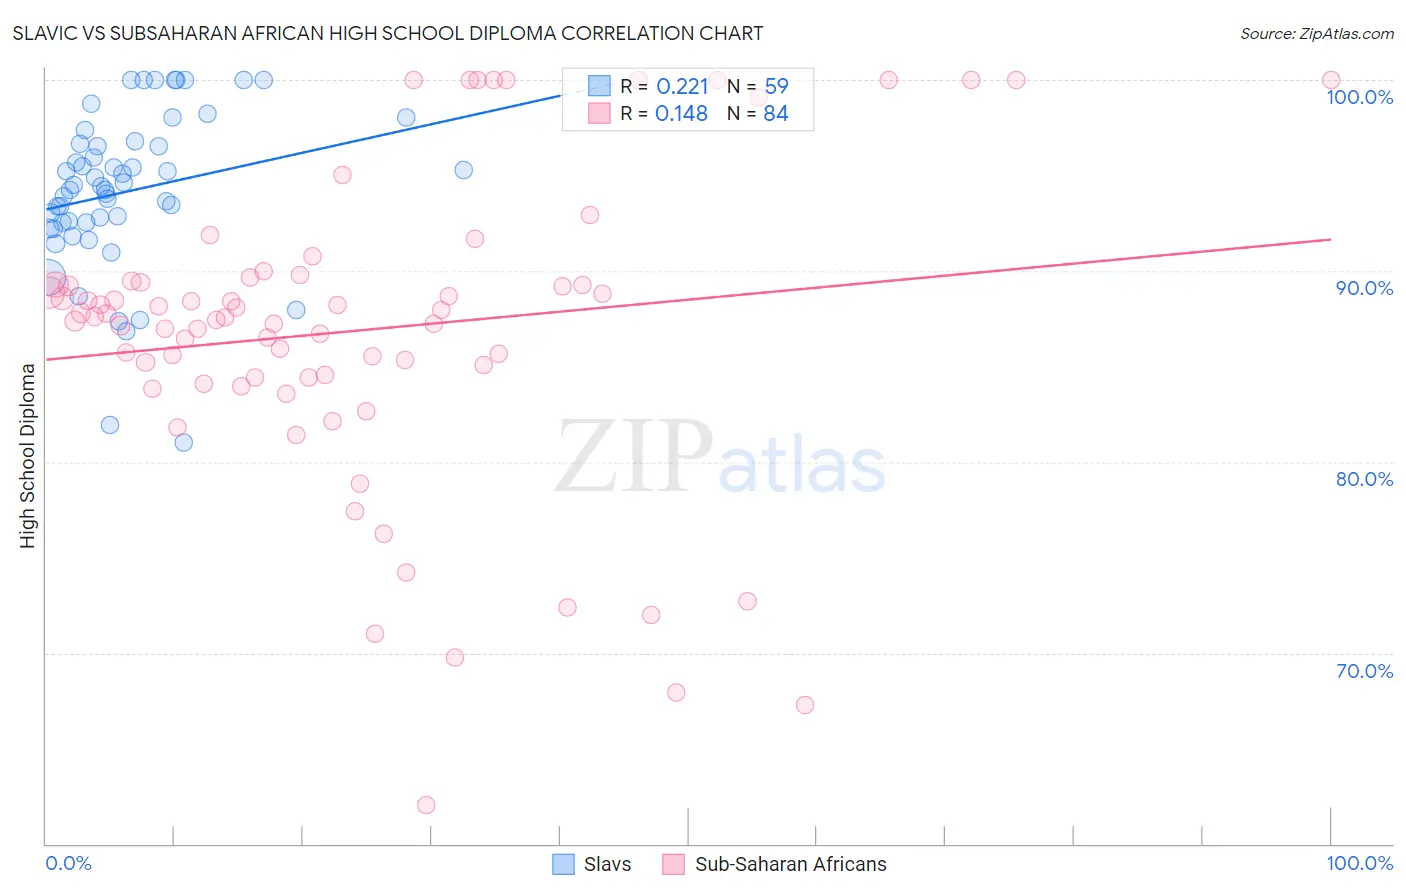
Slavic vs Subsaharan African High School Diploma Correlation Chart
The statistical analysis conducted on geographies consisting of 270,868,354 people shows a weak positive correlation between the proportion of Slavs and percentage of population with at least high school diploma education in the United States with a correlation coefficient (R) of 0.221 and weighted average of 91.0%. Similarly, the statistical analysis conducted on geographies consisting of 508,219,008 people shows a poor positive correlation between the proportion of Sub-Saharan Africans and percentage of population with at least high school diploma education in the United States with a correlation coefficient (R) of 0.148 and weighted average of 87.9%, a difference of 3.5%.
High School Diploma Correlation Summary
| Measurement | Slavic | Subsaharan African |
| Minimum | 81.0% | 62.1% |
| Maximum | 100.0% | 100.0% |
| Range | 19.0% | 37.9% |
| Mean | 94.2% | 86.9% |
| Median | 94.5% | 87.6% |
| Interquartile 25% (IQ1) | 92.6% | 84.4% |
| Interquartile 75% (IQ3) | 96.7% | 89.4% |
| Interquartile Range (IQR) | 4.1% | 5.0% |
| Standard Deviation (Sample) | 4.2% | 8.1% |
| Standard Deviation (Population) | 4.1% | 8.0% |
Similar Demographics by High School Diploma
Demographics Similar to Slavs by High School Diploma
In terms of high school diploma, the demographic groups most similar to Slavs are Immigrants from North America (91.0%, a difference of 0.0%), Zimbabwean (91.1%, a difference of 0.010%), Immigrants from Canada (91.1%, a difference of 0.030%), Immigrants from Japan (91.0%, a difference of 0.030%), and Immigrants from Taiwan (91.0%, a difference of 0.040%).
| Demographics | Rating | Rank | High School Diploma |
| New Zealanders | 99.7 /100 | #51 | Exceptional 91.1% |
| Immigrants | Sweden | 99.7 /100 | #52 | Exceptional 91.1% |
| Immigrants | Belgium | 99.7 /100 | #53 | Exceptional 91.1% |
| Macedonians | 99.7 /100 | #54 | Exceptional 91.1% |
| Serbians | 99.7 /100 | #55 | Exceptional 91.1% |
| Immigrants | Canada | 99.7 /100 | #56 | Exceptional 91.1% |
| Zimbabweans | 99.7 /100 | #57 | Exceptional 91.1% |
| Slavs | 99.7 /100 | #58 | Exceptional 91.0% |
| Immigrants | North America | 99.7 /100 | #59 | Exceptional 91.0% |
| Immigrants | Japan | 99.6 /100 | #60 | Exceptional 91.0% |
| Immigrants | Taiwan | 99.6 /100 | #61 | Exceptional 91.0% |
| Austrians | 99.6 /100 | #62 | Exceptional 91.0% |
| Immigrants | Netherlands | 99.6 /100 | #63 | Exceptional 91.0% |
| Ukrainians | 99.6 /100 | #64 | Exceptional 91.0% |
| Immigrants | South Africa | 99.6 /100 | #65 | Exceptional 91.0% |
Demographics Similar to Sub-Saharan Africans by High School Diploma
In terms of high school diploma, the demographic groups most similar to Sub-Saharan Africans are Taiwanese (87.9%, a difference of 0.010%), Sioux (87.9%, a difference of 0.010%), South American (87.9%, a difference of 0.010%), Immigrants from Bahamas (88.0%, a difference of 0.020%), and Immigrants from Panama (88.0%, a difference of 0.040%).
| Demographics | Rating | Rank | High School Diploma |
| Nigerians | 5.2 /100 | #229 | Tragic 88.2% |
| Blackfeet | 4.2 /100 | #230 | Tragic 88.1% |
| Colombians | 3.8 /100 | #231 | Tragic 88.1% |
| Immigrants | Middle Africa | 3.4 /100 | #232 | Tragic 88.0% |
| Immigrants | Panama | 3.1 /100 | #233 | Tragic 88.0% |
| Immigrants | Thailand | 3.1 /100 | #234 | Tragic 88.0% |
| Immigrants | Bahamas | 2.9 /100 | #235 | Tragic 88.0% |
| Sub-Saharan Africans | 2.8 /100 | #236 | Tragic 87.9% |
| Taiwanese | 2.8 /100 | #237 | Tragic 87.9% |
| Sioux | 2.7 /100 | #238 | Tragic 87.9% |
| South Americans | 2.7 /100 | #239 | Tragic 87.9% |
| Comanche | 2.2 /100 | #240 | Tragic 87.9% |
| Immigrants | Uzbekistan | 2.1 /100 | #241 | Tragic 87.8% |
| Cheyenne | 2.1 /100 | #242 | Tragic 87.8% |
| Immigrants | Philippines | 1.9 /100 | #243 | Tragic 87.8% |