Scotch-Irish vs Immigrants from Indonesia GED/Equivalency
COMPARE
Scotch-Irish
Immigrants from Indonesia
GED/Equivalency
GED/Equivalency Comparison
Scotch-Irish
Immigrants from Indonesia
86.8%
GED/EQUIVALENCY
91.6/ 100
METRIC RATING
120th/ 347
METRIC RANK
86.4%
GED/EQUIVALENCY
82.4/ 100
METRIC RATING
142nd/ 347
METRIC RANK
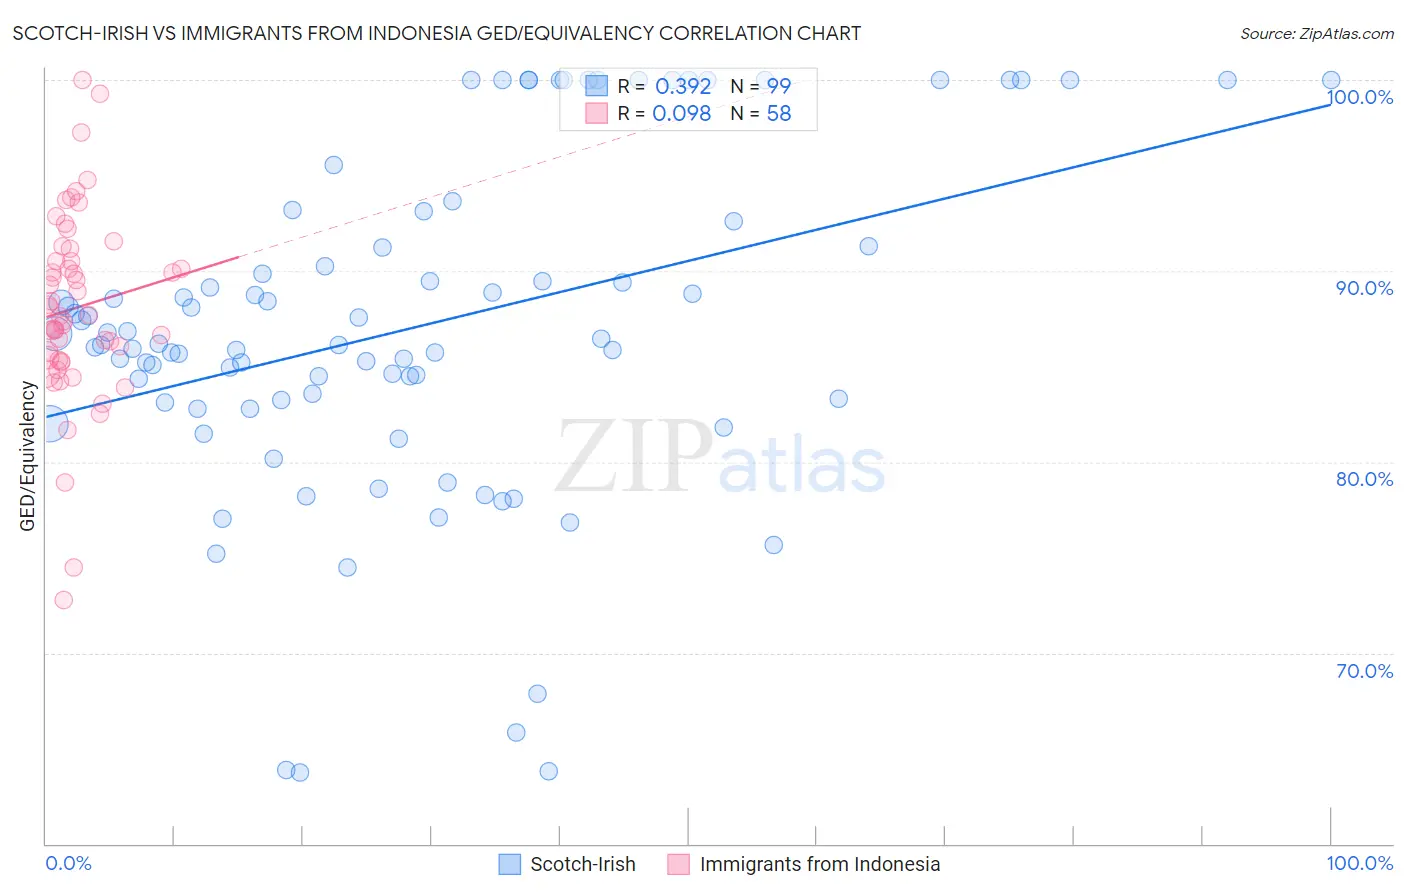
Scotch-Irish vs Immigrants from Indonesia GED/Equivalency Correlation Chart
The statistical analysis conducted on geographies consisting of 548,780,564 people shows a mild positive correlation between the proportion of Scotch-Irish and percentage of population with at least ged/equivalency education in the United States with a correlation coefficient (R) of 0.392 and weighted average of 86.8%. Similarly, the statistical analysis conducted on geographies consisting of 215,765,946 people shows a slight positive correlation between the proportion of Immigrants from Indonesia and percentage of population with at least ged/equivalency education in the United States with a correlation coefficient (R) of 0.098 and weighted average of 86.4%, a difference of 0.43%.
GED/Equivalency Correlation Summary
| Measurement | Scotch-Irish | Immigrants from Indonesia |
| Minimum | 63.7% | 72.8% |
| Maximum | 100.0% | 100.0% |
| Range | 36.3% | 27.2% |
| Mean | 87.0% | 88.1% |
| Median | 86.2% | 87.7% |
| Interquartile 25% (IQ1) | 83.1% | 85.4% |
| Interquartile 75% (IQ3) | 91.3% | 90.5% |
| Interquartile Range (IQR) | 8.2% | 5.2% |
| Standard Deviation (Sample) | 8.7% | 5.0% |
| Standard Deviation (Population) | 8.7% | 4.9% |
Similar Demographics by GED/Equivalency
Demographics Similar to Scotch-Irish by GED/Equivalency
In terms of ged/equivalency, the demographic groups most similar to Scotch-Irish are Immigrants from Lebanon (86.8%, a difference of 0.050%), Immigrants from Jordan (86.8%, a difference of 0.050%), Immigrants from Italy (86.7%, a difference of 0.070%), Immigrants from Egypt (86.7%, a difference of 0.080%), and Celtic (86.7%, a difference of 0.080%).
| Demographics | Rating | Rank | GED/Equivalency |
| Assyrians/Chaldeans/Syriacs | 94.8 /100 | #113 | Exceptional 87.0% |
| Immigrants | Kazakhstan | 94.7 /100 | #114 | Exceptional 87.0% |
| Mongolians | 94.6 /100 | #115 | Exceptional 87.0% |
| Swiss | 94.5 /100 | #116 | Exceptional 87.0% |
| Immigrants | Hong Kong | 93.8 /100 | #117 | Exceptional 86.9% |
| French Canadians | 93.2 /100 | #118 | Exceptional 86.9% |
| Immigrants | China | 93.2 /100 | #119 | Exceptional 86.9% |
| Scotch-Irish | 91.6 /100 | #120 | Exceptional 86.8% |
| Immigrants | Lebanon | 90.9 /100 | #121 | Exceptional 86.8% |
| Immigrants | Jordan | 90.8 /100 | #122 | Exceptional 86.8% |
| Immigrants | Italy | 90.5 /100 | #123 | Exceptional 86.7% |
| Immigrants | Egypt | 90.4 /100 | #124 | Exceptional 86.7% |
| Celtics | 90.4 /100 | #125 | Exceptional 86.7% |
| Asians | 90.3 /100 | #126 | Exceptional 86.7% |
| Argentineans | 89.7 /100 | #127 | Excellent 86.7% |
Demographics Similar to Immigrants from Indonesia by GED/Equivalency
In terms of ged/equivalency, the demographic groups most similar to Immigrants from Indonesia are Immigrants from Pakistan (86.4%, a difference of 0.0%), Bolivian (86.4%, a difference of 0.010%), Laotian (86.5%, a difference of 0.030%), Paraguayan (86.5%, a difference of 0.060%), and Pakistani (86.4%, a difference of 0.070%).
| Demographics | Rating | Rank | GED/Equivalency |
| Immigrants | Asia | 87.4 /100 | #135 | Excellent 86.6% |
| Chileans | 86.9 /100 | #136 | Excellent 86.6% |
| Arabs | 86.7 /100 | #137 | Excellent 86.6% |
| Immigrants | Argentina | 86.5 /100 | #138 | Excellent 86.6% |
| Immigrants | Malaysia | 85.0 /100 | #139 | Excellent 86.5% |
| Paraguayans | 84.1 /100 | #140 | Excellent 86.5% |
| Laotians | 83.2 /100 | #141 | Excellent 86.5% |
| Immigrants | Indonesia | 82.4 /100 | #142 | Excellent 86.4% |
| Immigrants | Pakistan | 82.4 /100 | #143 | Excellent 86.4% |
| Bolivians | 82.1 /100 | #144 | Excellent 86.4% |
| Pakistanis | 80.4 /100 | #145 | Excellent 86.4% |
| Basques | 79.5 /100 | #146 | Good 86.4% |
| Immigrants | Northern Africa | 79.3 /100 | #147 | Good 86.3% |
| Immigrants | Poland | 79.3 /100 | #148 | Good 86.3% |
| Menominee | 79.3 /100 | #149 | Good 86.3% |