Scotch-Irish vs Indian (Asian) GED/Equivalency
COMPARE
Scotch-Irish
Indian (Asian)
GED/Equivalency
GED/Equivalency Comparison
Scotch-Irish
Indians (Asian)
86.8%
GED/EQUIVALENCY
91.6/ 100
METRIC RATING
120th/ 347
METRIC RANK
87.1%
GED/EQUIVALENCY
95.9/ 100
METRIC RATING
105th/ 347
METRIC RANK
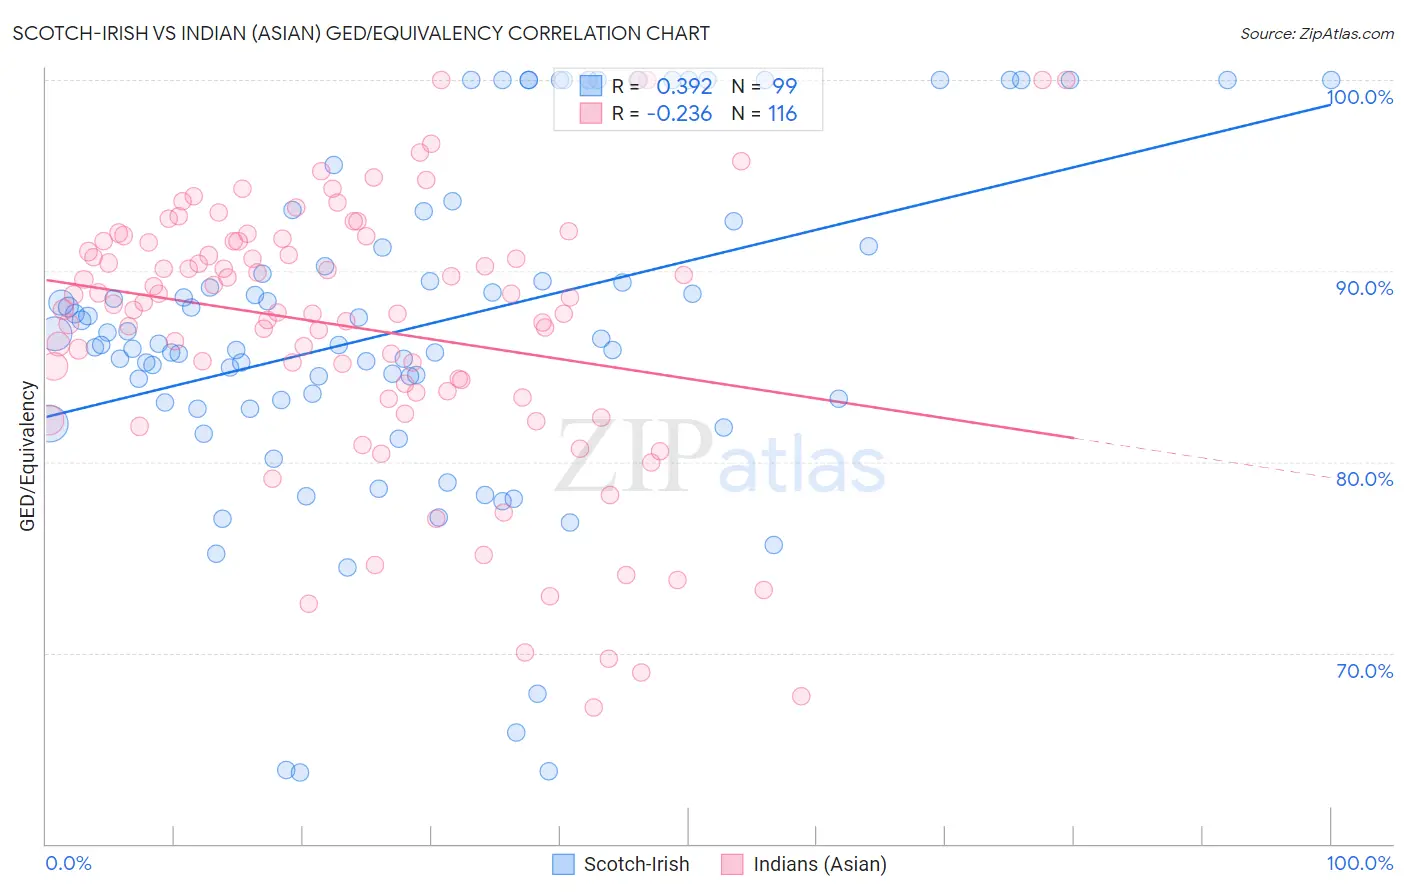
Scotch-Irish vs Indian (Asian) GED/Equivalency Correlation Chart
The statistical analysis conducted on geographies consisting of 548,780,564 people shows a mild positive correlation between the proportion of Scotch-Irish and percentage of population with at least ged/equivalency education in the United States with a correlation coefficient (R) of 0.392 and weighted average of 86.8%. Similarly, the statistical analysis conducted on geographies consisting of 495,347,994 people shows a weak negative correlation between the proportion of Indians (Asian) and percentage of population with at least ged/equivalency education in the United States with a correlation coefficient (R) of -0.236 and weighted average of 87.1%, a difference of 0.39%.
GED/Equivalency Correlation Summary
| Measurement | Scotch-Irish | Indian (Asian) |
| Minimum | 63.7% | 67.1% |
| Maximum | 100.0% | 100.0% |
| Range | 36.3% | 32.9% |
| Mean | 87.0% | 87.0% |
| Median | 86.2% | 88.3% |
| Interquartile 25% (IQ1) | 83.1% | 83.7% |
| Interquartile 75% (IQ3) | 91.3% | 91.6% |
| Interquartile Range (IQR) | 8.2% | 7.9% |
| Standard Deviation (Sample) | 8.7% | 7.1% |
| Standard Deviation (Population) | 8.7% | 7.1% |
Demographics Similar to Scotch-Irish and Indians (Asian) by GED/Equivalency
In terms of ged/equivalency, the demographic groups most similar to Scotch-Irish are Immigrants from Lebanon (86.8%, a difference of 0.050%), Immigrants from Jordan (86.8%, a difference of 0.050%), French Canadian (86.9%, a difference of 0.12%), Immigrants from China (86.9%, a difference of 0.12%), and Immigrants from Hong Kong (86.9%, a difference of 0.16%). Similarly, the demographic groups most similar to Indians (Asian) are Immigrants from Hungary (87.2%, a difference of 0.010%), Jordanian (87.2%, a difference of 0.020%), Immigrants from Zimbabwe (87.1%, a difference of 0.020%), Icelander (87.1%, a difference of 0.020%), and Lebanese (87.2%, a difference of 0.030%).
| Demographics | Rating | Rank | GED/Equivalency |
| Lebanese | 96.2 /100 | #102 | Exceptional 87.2% |
| Jordanians | 96.1 /100 | #103 | Exceptional 87.2% |
| Immigrants | Hungary | 96.0 /100 | #104 | Exceptional 87.2% |
| Indians (Asian) | 95.9 /100 | #105 | Exceptional 87.1% |
| Immigrants | Zimbabwe | 95.8 /100 | #106 | Exceptional 87.1% |
| Icelanders | 95.7 /100 | #107 | Exceptional 87.1% |
| Canadians | 95.6 /100 | #108 | Exceptional 87.1% |
| Immigrants | Eastern Europe | 95.5 /100 | #109 | Exceptional 87.1% |
| Egyptians | 95.3 /100 | #110 | Exceptional 87.1% |
| French | 95.2 /100 | #111 | Exceptional 87.1% |
| Tlingit-Haida | 94.8 /100 | #112 | Exceptional 87.0% |
| Assyrians/Chaldeans/Syriacs | 94.8 /100 | #113 | Exceptional 87.0% |
| Immigrants | Kazakhstan | 94.7 /100 | #114 | Exceptional 87.0% |
| Mongolians | 94.6 /100 | #115 | Exceptional 87.0% |
| Swiss | 94.5 /100 | #116 | Exceptional 87.0% |
| Immigrants | Hong Kong | 93.8 /100 | #117 | Exceptional 86.9% |
| French Canadians | 93.2 /100 | #118 | Exceptional 86.9% |
| Immigrants | China | 93.2 /100 | #119 | Exceptional 86.9% |
| Scotch-Irish | 91.6 /100 | #120 | Exceptional 86.8% |
| Immigrants | Lebanon | 90.9 /100 | #121 | Exceptional 86.8% |
| Immigrants | Jordan | 90.8 /100 | #122 | Exceptional 86.8% |