Scotch-Irish vs Immigrants from Indonesia In Labor Force | Age 20-24
COMPARE
Scotch-Irish
Immigrants from Indonesia
In Labor Force | Age 20-24
In Labor Force | Age 20-24 Comparison
Scotch-Irish
Immigrants from Indonesia
77.0%
IN LABOR FORCE | AGE 20-24
99.9/ 100
METRIC RATING
59th/ 347
METRIC RANK
73.4%
IN LABOR FORCE | AGE 20-24
0.3/ 100
METRIC RATING
271st/ 347
METRIC RANK
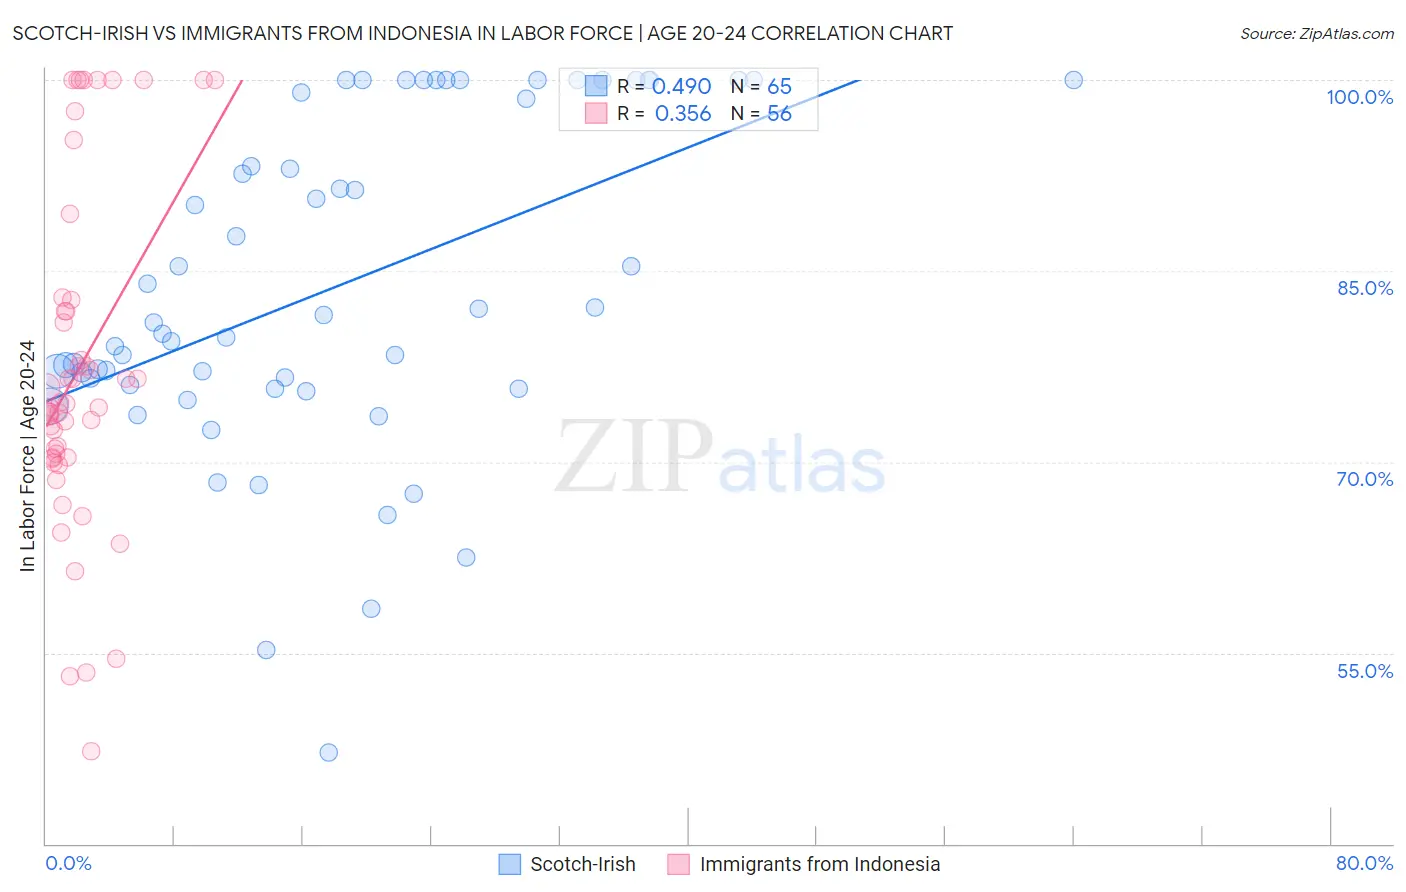
Scotch-Irish vs Immigrants from Indonesia In Labor Force | Age 20-24 Correlation Chart
The statistical analysis conducted on geographies consisting of 547,632,235 people shows a moderate positive correlation between the proportion of Scotch-Irish and labor force participation rate among population between the ages 20 and 24 in the United States with a correlation coefficient (R) of 0.490 and weighted average of 77.0%. Similarly, the statistical analysis conducted on geographies consisting of 215,731,978 people shows a mild positive correlation between the proportion of Immigrants from Indonesia and labor force participation rate among population between the ages 20 and 24 in the United States with a correlation coefficient (R) of 0.356 and weighted average of 73.4%, a difference of 4.9%.
In Labor Force | Age 20-24 Correlation Summary
| Measurement | Scotch-Irish | Immigrants from Indonesia |
| Minimum | 47.2% | 47.3% |
| Maximum | 100.0% | 100.0% |
| Range | 52.8% | 52.7% |
| Mean | 83.8% | 77.4% |
| Median | 81.0% | 74.4% |
| Interquartile 25% (IQ1) | 75.9% | 70.4% |
| Interquartile 75% (IQ3) | 99.5% | 82.3% |
| Interquartile Range (IQR) | 23.6% | 11.9% |
| Standard Deviation (Sample) | 13.0% | 13.3% |
| Standard Deviation (Population) | 12.9% | 13.1% |
Similar Demographics by In Labor Force | Age 20-24
Demographics Similar to Scotch-Irish by In Labor Force | Age 20-24
In terms of in labor force | age 20-24, the demographic groups most similar to Scotch-Irish are Hawaiian (77.0%, a difference of 0.030%), Kenyan (77.0%, a difference of 0.040%), Chippewa (77.1%, a difference of 0.050%), European (77.1%, a difference of 0.060%), and Immigrants from Liberia (77.1%, a difference of 0.070%).
| Demographics | Rating | Rank | In Labor Force | Age 20-24 |
| Indonesians | 100.0 /100 | #52 | Exceptional 77.2% |
| Immigrants | Azores | 100.0 /100 | #53 | Exceptional 77.2% |
| Celtics | 99.9 /100 | #54 | Exceptional 77.1% |
| Immigrants | Liberia | 99.9 /100 | #55 | Exceptional 77.1% |
| Europeans | 99.9 /100 | #56 | Exceptional 77.1% |
| Chippewa | 99.9 /100 | #57 | Exceptional 77.1% |
| Hawaiians | 99.9 /100 | #58 | Exceptional 77.0% |
| Scotch-Irish | 99.9 /100 | #59 | Exceptional 77.0% |
| Kenyans | 99.9 /100 | #60 | Exceptional 77.0% |
| Immigrants | Eritrea | 99.9 /100 | #61 | Exceptional 77.0% |
| Immigrants | Kenya | 99.9 /100 | #62 | Exceptional 77.0% |
| Lithuanians | 99.9 /100 | #63 | Exceptional 77.0% |
| Whites/Caucasians | 99.9 /100 | #64 | Exceptional 76.9% |
| Crow | 99.9 /100 | #65 | Exceptional 76.9% |
| Icelanders | 99.9 /100 | #66 | Exceptional 76.9% |
Demographics Similar to Immigrants from Indonesia by In Labor Force | Age 20-24
In terms of in labor force | age 20-24, the demographic groups most similar to Immigrants from Indonesia are Belizean (73.4%, a difference of 0.010%), Cheyenne (73.4%, a difference of 0.040%), Immigrants from Russia (73.5%, a difference of 0.050%), Immigrants from Colombia (73.4%, a difference of 0.060%), and Colombian (73.5%, a difference of 0.090%).
| Demographics | Rating | Rank | In Labor Force | Age 20-24 |
| Immigrants | Haiti | 0.5 /100 | #264 | Tragic 73.6% |
| Burmese | 0.5 /100 | #265 | Tragic 73.6% |
| Haitians | 0.5 /100 | #266 | Tragic 73.6% |
| Immigrants | Western Asia | 0.4 /100 | #267 | Tragic 73.5% |
| South Americans | 0.4 /100 | #268 | Tragic 73.5% |
| Colombians | 0.3 /100 | #269 | Tragic 73.5% |
| Immigrants | Russia | 0.3 /100 | #270 | Tragic 73.5% |
| Immigrants | Indonesia | 0.3 /100 | #271 | Tragic 73.4% |
| Belizeans | 0.3 /100 | #272 | Tragic 73.4% |
| Cheyenne | 0.2 /100 | #273 | Tragic 73.4% |
| Immigrants | Colombia | 0.2 /100 | #274 | Tragic 73.4% |
| Immigrants | South America | 0.2 /100 | #275 | Tragic 73.3% |
| Mongolians | 0.2 /100 | #276 | Tragic 73.3% |
| Immigrants | Malaysia | 0.2 /100 | #277 | Tragic 73.3% |
| Cypriots | 0.2 /100 | #278 | Tragic 73.3% |