Scotch-Irish vs Paiute GED/Equivalency
COMPARE
Scotch-Irish
Paiute
GED/Equivalency
GED/Equivalency Comparison
Scotch-Irish
Paiute
86.8%
GED/EQUIVALENCY
91.6/ 100
METRIC RATING
120th/ 347
METRIC RANK
82.0%
GED/EQUIVALENCY
0.0/ 100
METRIC RATING
292nd/ 347
METRIC RANK
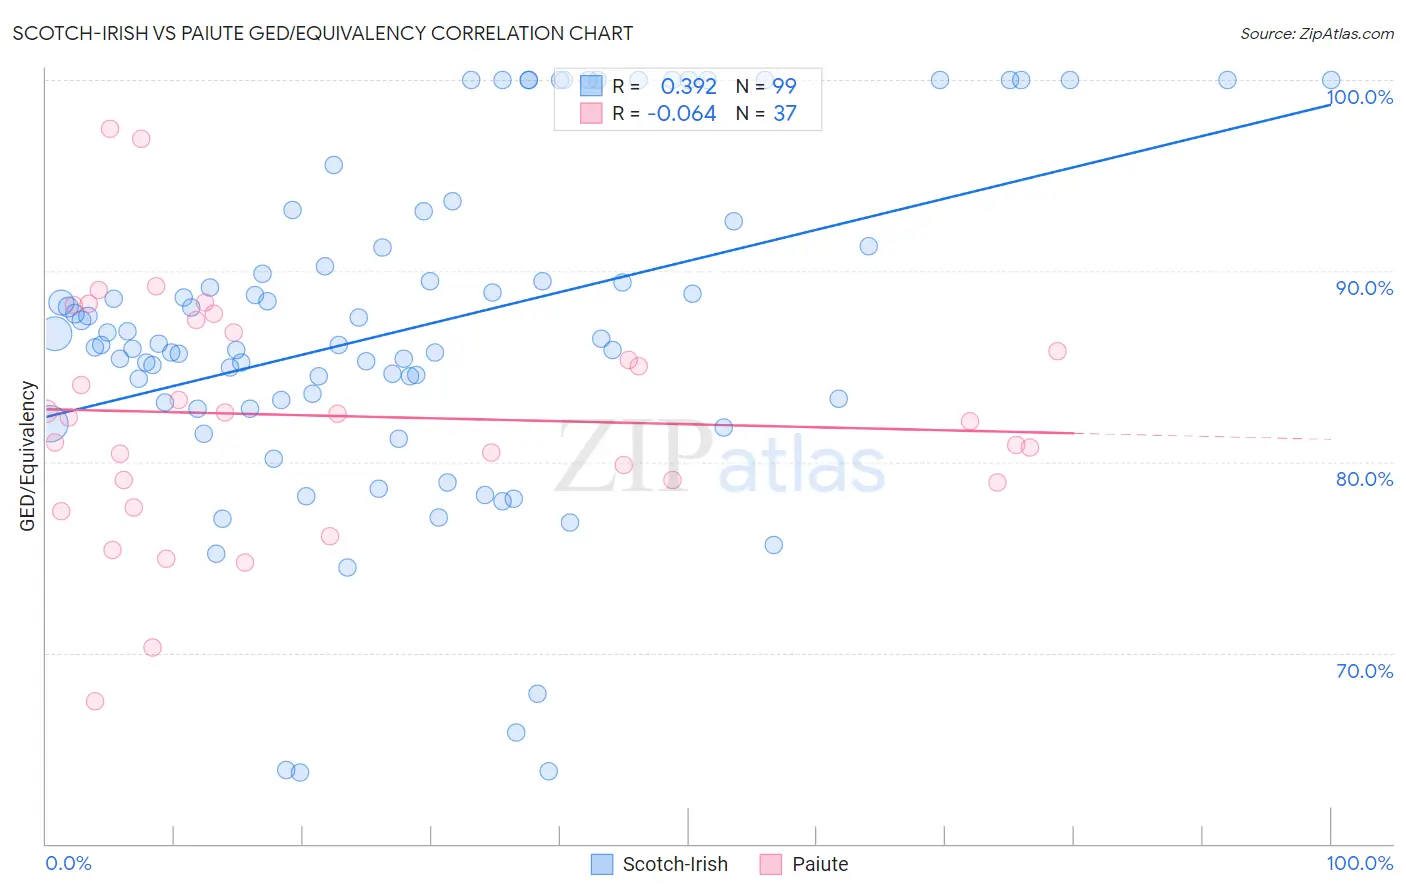
Scotch-Irish vs Paiute GED/Equivalency Correlation Chart
The statistical analysis conducted on geographies consisting of 548,780,564 people shows a mild positive correlation between the proportion of Scotch-Irish and percentage of population with at least ged/equivalency education in the United States with a correlation coefficient (R) of 0.392 and weighted average of 86.8%. Similarly, the statistical analysis conducted on geographies consisting of 58,404,221 people shows a slight negative correlation between the proportion of Paiute and percentage of population with at least ged/equivalency education in the United States with a correlation coefficient (R) of -0.064 and weighted average of 82.0%, a difference of 5.8%.
GED/Equivalency Correlation Summary
| Measurement | Scotch-Irish | Paiute |
| Minimum | 63.7% | 67.5% |
| Maximum | 100.0% | 97.4% |
| Range | 36.3% | 29.9% |
| Mean | 87.0% | 82.4% |
| Median | 86.2% | 82.3% |
| Interquartile 25% (IQ1) | 83.1% | 79.0% |
| Interquartile 75% (IQ3) | 91.3% | 87.1% |
| Interquartile Range (IQR) | 8.2% | 8.1% |
| Standard Deviation (Sample) | 8.7% | 6.3% |
| Standard Deviation (Population) | 8.7% | 6.2% |
Similar Demographics by GED/Equivalency
Demographics Similar to Scotch-Irish by GED/Equivalency
In terms of ged/equivalency, the demographic groups most similar to Scotch-Irish are Immigrants from Lebanon (86.8%, a difference of 0.050%), Immigrants from Jordan (86.8%, a difference of 0.050%), Immigrants from Italy (86.7%, a difference of 0.070%), Immigrants from Egypt (86.7%, a difference of 0.080%), and Celtic (86.7%, a difference of 0.080%).
| Demographics | Rating | Rank | GED/Equivalency |
| Assyrians/Chaldeans/Syriacs | 94.8 /100 | #113 | Exceptional 87.0% |
| Immigrants | Kazakhstan | 94.7 /100 | #114 | Exceptional 87.0% |
| Mongolians | 94.6 /100 | #115 | Exceptional 87.0% |
| Swiss | 94.5 /100 | #116 | Exceptional 87.0% |
| Immigrants | Hong Kong | 93.8 /100 | #117 | Exceptional 86.9% |
| French Canadians | 93.2 /100 | #118 | Exceptional 86.9% |
| Immigrants | China | 93.2 /100 | #119 | Exceptional 86.9% |
| Scotch-Irish | 91.6 /100 | #120 | Exceptional 86.8% |
| Immigrants | Lebanon | 90.9 /100 | #121 | Exceptional 86.8% |
| Immigrants | Jordan | 90.8 /100 | #122 | Exceptional 86.8% |
| Immigrants | Italy | 90.5 /100 | #123 | Exceptional 86.7% |
| Immigrants | Egypt | 90.4 /100 | #124 | Exceptional 86.7% |
| Celtics | 90.4 /100 | #125 | Exceptional 86.7% |
| Asians | 90.3 /100 | #126 | Exceptional 86.7% |
| Argentineans | 89.7 /100 | #127 | Excellent 86.7% |
Demographics Similar to Paiute by GED/Equivalency
In terms of ged/equivalency, the demographic groups most similar to Paiute are British West Indian (82.0%, a difference of 0.010%), Immigrants from St. Vincent and the Grenadines (82.0%, a difference of 0.030%), Cuban (82.0%, a difference of 0.040%), Haitian (82.1%, a difference of 0.060%), and Nepalese (81.9%, a difference of 0.090%).
| Demographics | Rating | Rank | GED/Equivalency |
| Cajuns | 0.0 /100 | #285 | Tragic 82.4% |
| Immigrants | West Indies | 0.0 /100 | #286 | Tragic 82.4% |
| Japanese | 0.0 /100 | #287 | Tragic 82.4% |
| Pueblo | 0.0 /100 | #288 | Tragic 82.3% |
| Immigrants | Cambodia | 0.0 /100 | #289 | Tragic 82.2% |
| Haitians | 0.0 /100 | #290 | Tragic 82.1% |
| Cubans | 0.0 /100 | #291 | Tragic 82.0% |
| Paiute | 0.0 /100 | #292 | Tragic 82.0% |
| British West Indians | 0.0 /100 | #293 | Tragic 82.0% |
| Immigrants | St. Vincent and the Grenadines | 0.0 /100 | #294 | Tragic 82.0% |
| Nepalese | 0.0 /100 | #295 | Tragic 81.9% |
| Vietnamese | 0.0 /100 | #296 | Tragic 81.9% |
| Immigrants | Bangladesh | 0.0 /100 | #297 | Tragic 81.9% |
| Ute | 0.0 /100 | #298 | Tragic 81.8% |
| Ecuadorians | 0.0 /100 | #299 | Tragic 81.7% |