Scotch-Irish vs Immigrants from Ghana 11th Grade
COMPARE
Scotch-Irish
Immigrants from Ghana
11th Grade
11th Grade Comparison
Scotch-Irish
Immigrants from Ghana
93.9%
11TH GRADE
99.8/ 100
METRIC RATING
69th/ 347
METRIC RANK
91.2%
11TH GRADE
0.3/ 100
METRIC RATING
263rd/ 347
METRIC RANK
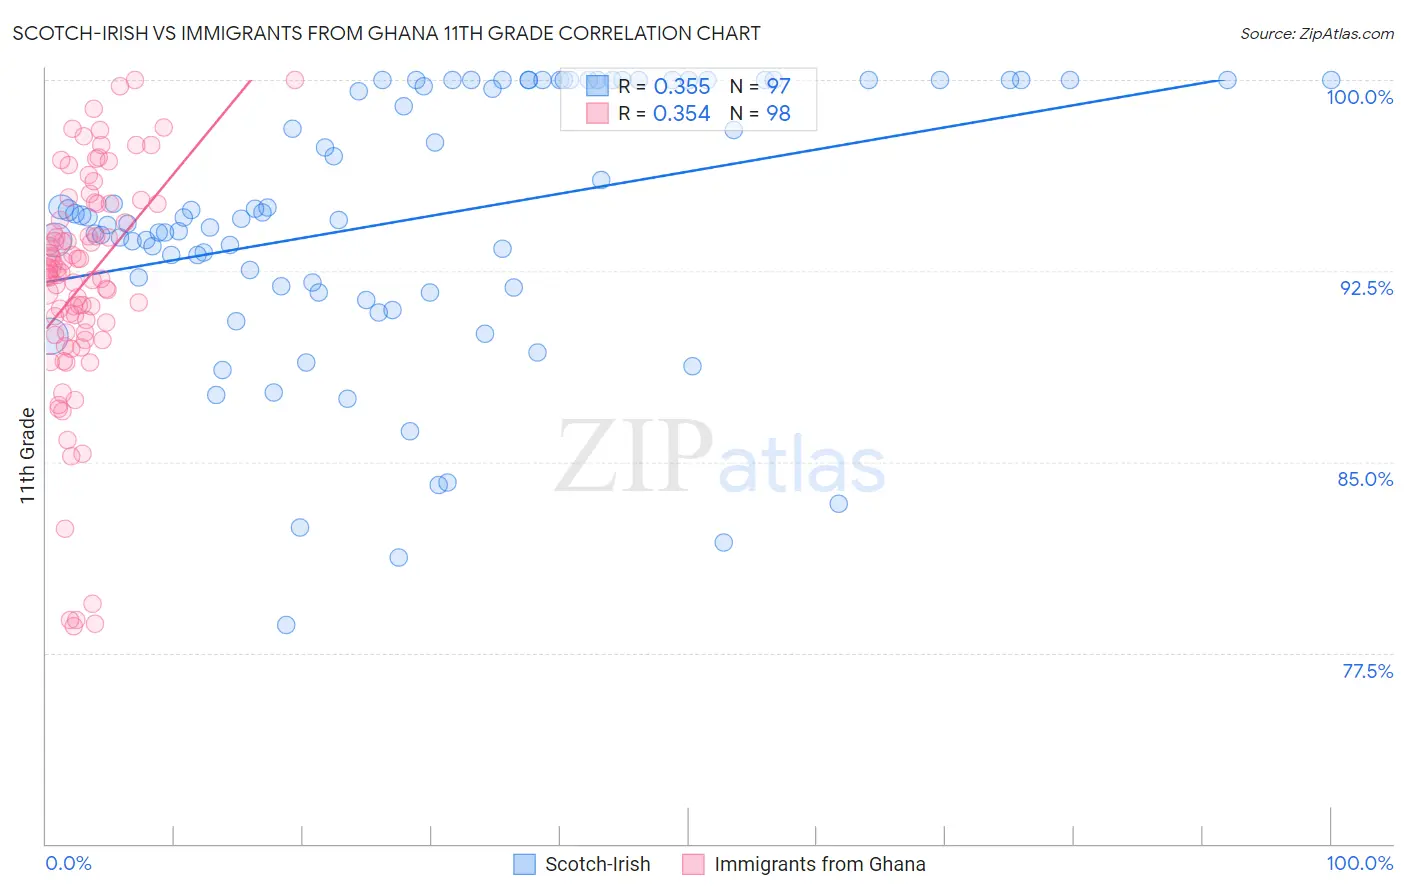
Scotch-Irish vs Immigrants from Ghana 11th Grade Correlation Chart
The statistical analysis conducted on geographies consisting of 548,779,872 people shows a mild positive correlation between the proportion of Scotch-Irish and percentage of population with at least 11th grade education in the United States with a correlation coefficient (R) of 0.355 and weighted average of 93.9%. Similarly, the statistical analysis conducted on geographies consisting of 199,951,730 people shows a mild positive correlation between the proportion of Immigrants from Ghana and percentage of population with at least 11th grade education in the United States with a correlation coefficient (R) of 0.354 and weighted average of 91.2%, a difference of 2.9%.
11th Grade Correlation Summary
| Measurement | Scotch-Irish | Immigrants from Ghana |
| Minimum | 78.6% | 78.5% |
| Maximum | 100.0% | 100.0% |
| Range | 21.4% | 21.5% |
| Mean | 94.5% | 92.0% |
| Median | 94.6% | 92.4% |
| Interquartile 25% (IQ1) | 91.9% | 90.1% |
| Interquartile 75% (IQ3) | 100.0% | 95.1% |
| Interquartile Range (IQR) | 8.1% | 5.0% |
| Standard Deviation (Sample) | 5.2% | 4.6% |
| Standard Deviation (Population) | 5.1% | 4.6% |
Similar Demographics by 11th Grade
Demographics Similar to Scotch-Irish by 11th Grade
In terms of 11th grade, the demographic groups most similar to Scotch-Irish are Zimbabwean (93.9%, a difference of 0.0%), Alaskan Athabascan (93.9%, a difference of 0.020%), Immigrants from Netherlands (93.9%, a difference of 0.020%), Immigrants from Sweden (93.9%, a difference of 0.040%), and Native Hawaiian (93.9%, a difference of 0.040%).
| Demographics | Rating | Rank | 11th Grade |
| Austrians | 99.8 /100 | #62 | Exceptional 94.0% |
| Ukrainians | 99.8 /100 | #63 | Exceptional 94.0% |
| Immigrants | Sweden | 99.8 /100 | #64 | Exceptional 93.9% |
| Native Hawaiians | 99.8 /100 | #65 | Exceptional 93.9% |
| Alaskan Athabascans | 99.8 /100 | #66 | Exceptional 93.9% |
| Immigrants | Netherlands | 99.8 /100 | #67 | Exceptional 93.9% |
| Zimbabweans | 99.8 /100 | #68 | Exceptional 93.9% |
| Scotch-Irish | 99.8 /100 | #69 | Exceptional 93.9% |
| Immigrants | England | 99.7 /100 | #70 | Exceptional 93.8% |
| Immigrants | South Africa | 99.7 /100 | #71 | Exceptional 93.8% |
| Immigrants | Japan | 99.7 /100 | #72 | Exceptional 93.8% |
| Romanians | 99.6 /100 | #73 | Exceptional 93.8% |
| Immigrants | Czechoslovakia | 99.6 /100 | #74 | Exceptional 93.8% |
| Immigrants | Latvia | 99.6 /100 | #75 | Exceptional 93.8% |
| Celtics | 99.5 /100 | #76 | Exceptional 93.7% |
Demographics Similar to Immigrants from Ghana by 11th Grade
In terms of 11th grade, the demographic groups most similar to Immigrants from Ghana are Yup'ik (91.2%, a difference of 0.020%), Pueblo (91.2%, a difference of 0.020%), Immigrants from Western Africa (91.2%, a difference of 0.050%), Immigrants from Jamaica (91.2%, a difference of 0.050%), and Immigrants from Uruguay (91.3%, a difference of 0.13%).
| Demographics | Rating | Rank | 11th Grade |
| Immigrants | Senegal | 0.7 /100 | #256 | Tragic 91.4% |
| Cajuns | 0.7 /100 | #257 | Tragic 91.4% |
| Immigrants | Colombia | 0.6 /100 | #258 | Tragic 91.4% |
| Jamaicans | 0.6 /100 | #259 | Tragic 91.4% |
| Spanish Americans | 0.6 /100 | #260 | Tragic 91.4% |
| Taiwanese | 0.6 /100 | #261 | Tragic 91.3% |
| Immigrants | Uruguay | 0.5 /100 | #262 | Tragic 91.3% |
| Immigrants | Ghana | 0.3 /100 | #263 | Tragic 91.2% |
| Yup'ik | 0.3 /100 | #264 | Tragic 91.2% |
| Pueblo | 0.3 /100 | #265 | Tragic 91.2% |
| Immigrants | Western Africa | 0.3 /100 | #266 | Tragic 91.2% |
| Immigrants | Jamaica | 0.3 /100 | #267 | Tragic 91.2% |
| U.S. Virgin Islanders | 0.2 /100 | #268 | Tragic 91.1% |
| Ute | 0.2 /100 | #269 | Tragic 91.1% |
| Trinidadians and Tobagonians | 0.2 /100 | #270 | Tragic 91.1% |