Scotch-Irish vs Inupiat 11th Grade
COMPARE
Scotch-Irish
Inupiat
11th Grade
11th Grade Comparison
Scotch-Irish
Inupiat
93.9%
11TH GRADE
99.8/ 100
METRIC RATING
69th/ 347
METRIC RANK
92.4%
11TH GRADE
40.7/ 100
METRIC RATING
180th/ 347
METRIC RANK
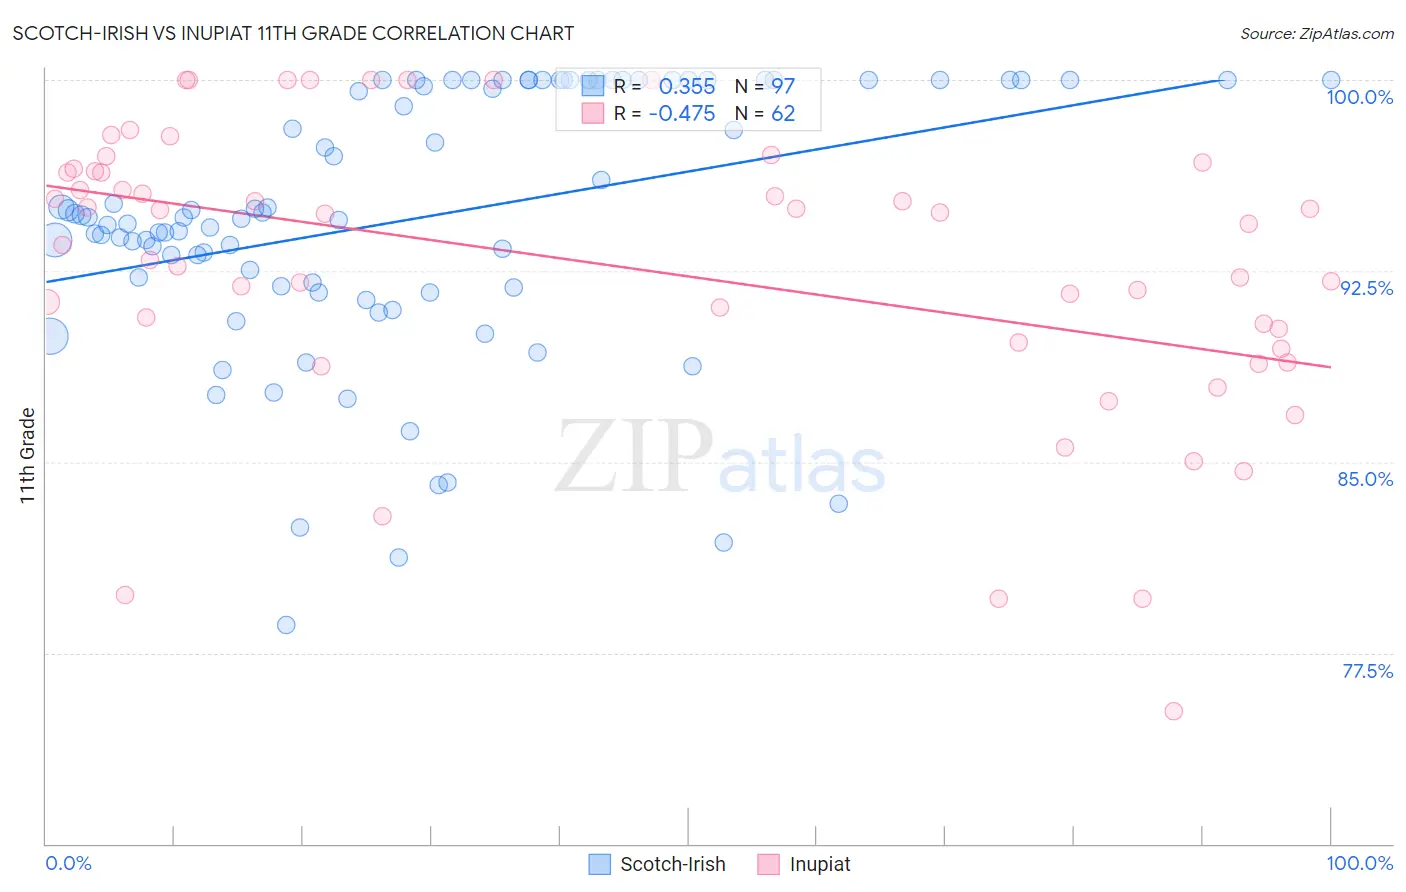
Scotch-Irish vs Inupiat 11th Grade Correlation Chart
The statistical analysis conducted on geographies consisting of 548,779,872 people shows a mild positive correlation between the proportion of Scotch-Irish and percentage of population with at least 11th grade education in the United States with a correlation coefficient (R) of 0.355 and weighted average of 93.9%. Similarly, the statistical analysis conducted on geographies consisting of 96,349,180 people shows a moderate negative correlation between the proportion of Inupiat and percentage of population with at least 11th grade education in the United States with a correlation coefficient (R) of -0.475 and weighted average of 92.4%, a difference of 1.6%.
11th Grade Correlation Summary
| Measurement | Scotch-Irish | Inupiat |
| Minimum | 78.6% | 75.2% |
| Maximum | 100.0% | 100.0% |
| Range | 21.4% | 24.8% |
| Mean | 94.5% | 92.7% |
| Median | 94.6% | 94.5% |
| Interquartile 25% (IQ1) | 91.9% | 89.7% |
| Interquartile 75% (IQ3) | 100.0% | 96.4% |
| Interquartile Range (IQR) | 8.1% | 6.7% |
| Standard Deviation (Sample) | 5.2% | 5.7% |
| Standard Deviation (Population) | 5.1% | 5.6% |
Similar Demographics by 11th Grade
Demographics Similar to Scotch-Irish by 11th Grade
In terms of 11th grade, the demographic groups most similar to Scotch-Irish are Zimbabwean (93.9%, a difference of 0.0%), Alaskan Athabascan (93.9%, a difference of 0.020%), Immigrants from Netherlands (93.9%, a difference of 0.020%), Immigrants from Sweden (93.9%, a difference of 0.040%), and Native Hawaiian (93.9%, a difference of 0.040%).
| Demographics | Rating | Rank | 11th Grade |
| Austrians | 99.8 /100 | #62 | Exceptional 94.0% |
| Ukrainians | 99.8 /100 | #63 | Exceptional 94.0% |
| Immigrants | Sweden | 99.8 /100 | #64 | Exceptional 93.9% |
| Native Hawaiians | 99.8 /100 | #65 | Exceptional 93.9% |
| Alaskan Athabascans | 99.8 /100 | #66 | Exceptional 93.9% |
| Immigrants | Netherlands | 99.8 /100 | #67 | Exceptional 93.9% |
| Zimbabweans | 99.8 /100 | #68 | Exceptional 93.9% |
| Scotch-Irish | 99.8 /100 | #69 | Exceptional 93.9% |
| Immigrants | England | 99.7 /100 | #70 | Exceptional 93.8% |
| Immigrants | South Africa | 99.7 /100 | #71 | Exceptional 93.8% |
| Immigrants | Japan | 99.7 /100 | #72 | Exceptional 93.8% |
| Romanians | 99.6 /100 | #73 | Exceptional 93.8% |
| Immigrants | Czechoslovakia | 99.6 /100 | #74 | Exceptional 93.8% |
| Immigrants | Latvia | 99.6 /100 | #75 | Exceptional 93.8% |
| Celtics | 99.5 /100 | #76 | Exceptional 93.7% |
Demographics Similar to Inupiat by 11th Grade
In terms of 11th grade, the demographic groups most similar to Inupiat are Creek (92.4%, a difference of 0.0%), Cherokee (92.4%, a difference of 0.0%), Immigrants from Morocco (92.4%, a difference of 0.020%), Sudanese (92.5%, a difference of 0.030%), and Immigrants from Malaysia (92.4%, a difference of 0.030%).
| Demographics | Rating | Rank | 11th Grade |
| Indians (Asian) | 51.5 /100 | #173 | Average 92.5% |
| Asians | 50.0 /100 | #174 | Average 92.5% |
| Shoshone | 48.9 /100 | #175 | Average 92.5% |
| Spaniards | 46.9 /100 | #176 | Average 92.5% |
| Guamanians/Chamorros | 45.0 /100 | #177 | Average 92.5% |
| Sudanese | 43.4 /100 | #178 | Average 92.5% |
| Creek | 40.9 /100 | #179 | Average 92.4% |
| Inupiat | 40.7 /100 | #180 | Average 92.4% |
| Cherokee | 40.7 /100 | #181 | Average 92.4% |
| Immigrants | Morocco | 38.6 /100 | #182 | Fair 92.4% |
| Immigrants | Malaysia | 37.6 /100 | #183 | Fair 92.4% |
| Immigrants | Asia | 37.4 /100 | #184 | Fair 92.4% |
| Immigrants | Nepal | 36.4 /100 | #185 | Fair 92.4% |
| Arapaho | 35.1 /100 | #186 | Fair 92.4% |
| Immigrants | Western Asia | 35.0 /100 | #187 | Fair 92.4% |