Scotch-Irish vs Tsimshian 11th Grade
COMPARE
Scotch-Irish
Tsimshian
11th Grade
11th Grade Comparison
Scotch-Irish
Tsimshian
93.9%
11TH GRADE
99.8/ 100
METRIC RATING
69th/ 347
METRIC RANK
94.4%
11TH GRADE
100.0/ 100
METRIC RATING
22nd/ 347
METRIC RANK
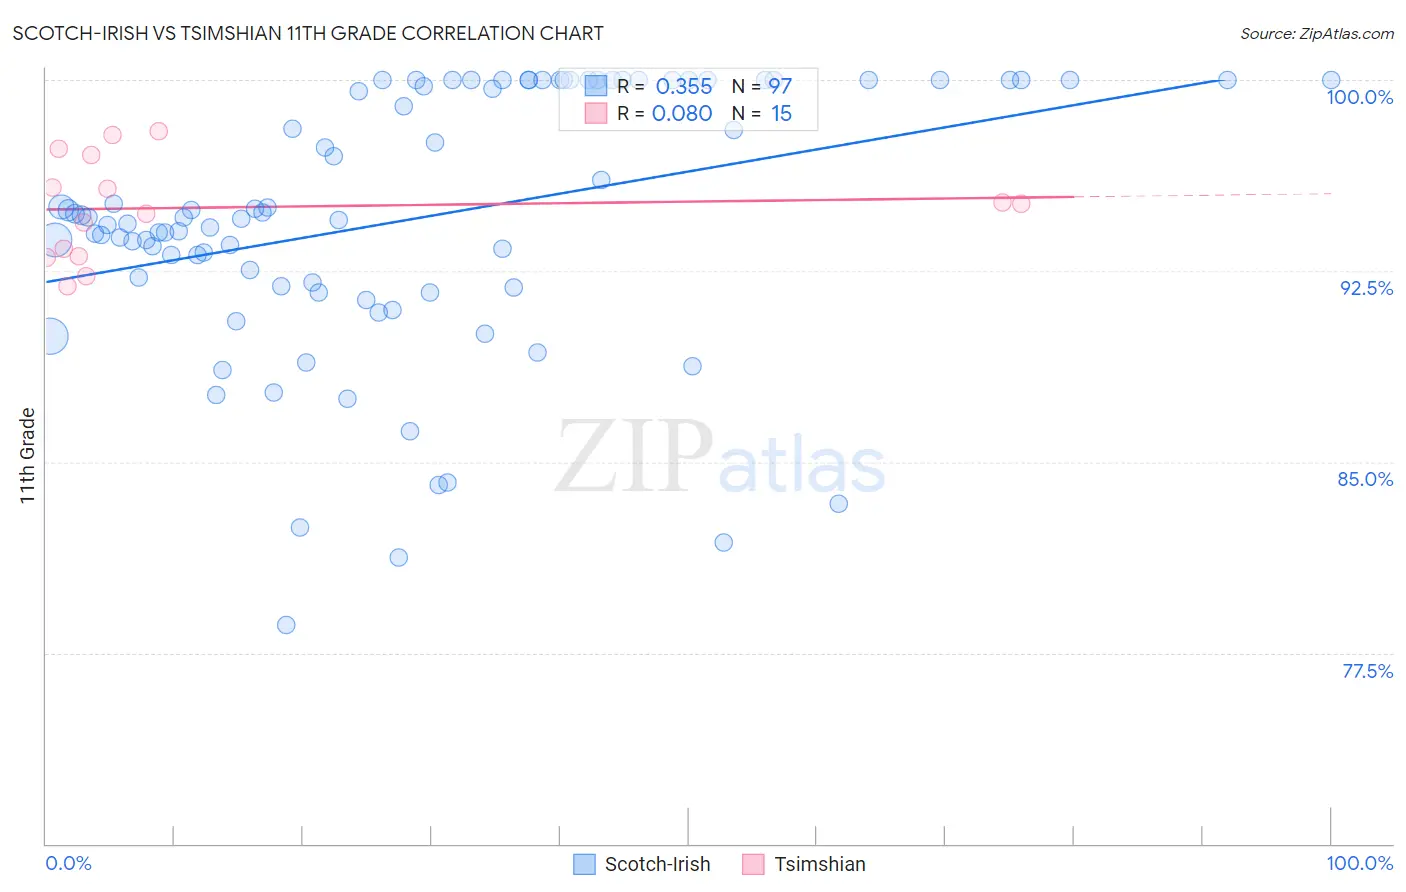
Scotch-Irish vs Tsimshian 11th Grade Correlation Chart
The statistical analysis conducted on geographies consisting of 548,779,872 people shows a mild positive correlation between the proportion of Scotch-Irish and percentage of population with at least 11th grade education in the United States with a correlation coefficient (R) of 0.355 and weighted average of 93.9%. Similarly, the statistical analysis conducted on geographies consisting of 15,626,544 people shows a slight positive correlation between the proportion of Tsimshian and percentage of population with at least 11th grade education in the United States with a correlation coefficient (R) of 0.080 and weighted average of 94.4%, a difference of 0.57%.
11th Grade Correlation Summary
| Measurement | Scotch-Irish | Tsimshian |
| Minimum | 78.6% | 91.9% |
| Maximum | 100.0% | 98.0% |
| Range | 21.4% | 6.1% |
| Mean | 94.5% | 95.0% |
| Median | 94.6% | 95.1% |
| Interquartile 25% (IQ1) | 91.9% | 93.1% |
| Interquartile 75% (IQ3) | 100.0% | 97.0% |
| Interquartile Range (IQR) | 8.1% | 4.0% |
| Standard Deviation (Sample) | 5.2% | 2.0% |
| Standard Deviation (Population) | 5.1% | 1.9% |
Similar Demographics by 11th Grade
Demographics Similar to Scotch-Irish by 11th Grade
In terms of 11th grade, the demographic groups most similar to Scotch-Irish are Zimbabwean (93.9%, a difference of 0.0%), Alaskan Athabascan (93.9%, a difference of 0.020%), Immigrants from Netherlands (93.9%, a difference of 0.020%), Immigrants from Sweden (93.9%, a difference of 0.040%), and Native Hawaiian (93.9%, a difference of 0.040%).
| Demographics | Rating | Rank | 11th Grade |
| Austrians | 99.8 /100 | #62 | Exceptional 94.0% |
| Ukrainians | 99.8 /100 | #63 | Exceptional 94.0% |
| Immigrants | Sweden | 99.8 /100 | #64 | Exceptional 93.9% |
| Native Hawaiians | 99.8 /100 | #65 | Exceptional 93.9% |
| Alaskan Athabascans | 99.8 /100 | #66 | Exceptional 93.9% |
| Immigrants | Netherlands | 99.8 /100 | #67 | Exceptional 93.9% |
| Zimbabweans | 99.8 /100 | #68 | Exceptional 93.9% |
| Scotch-Irish | 99.8 /100 | #69 | Exceptional 93.9% |
| Immigrants | England | 99.7 /100 | #70 | Exceptional 93.8% |
| Immigrants | South Africa | 99.7 /100 | #71 | Exceptional 93.8% |
| Immigrants | Japan | 99.7 /100 | #72 | Exceptional 93.8% |
| Romanians | 99.6 /100 | #73 | Exceptional 93.8% |
| Immigrants | Czechoslovakia | 99.6 /100 | #74 | Exceptional 93.8% |
| Immigrants | Latvia | 99.6 /100 | #75 | Exceptional 93.8% |
| Celtics | 99.5 /100 | #76 | Exceptional 93.7% |
Demographics Similar to Tsimshian by 11th Grade
In terms of 11th grade, the demographic groups most similar to Tsimshian are Czech (94.4%, a difference of 0.0%), Tlingit-Haida (94.4%, a difference of 0.010%), Italian (94.5%, a difference of 0.020%), English (94.4%, a difference of 0.030%), and Irish (94.4%, a difference of 0.050%).
| Demographics | Rating | Rank | 11th Grade |
| Bulgarians | 100.0 /100 | #15 | Exceptional 94.5% |
| Immigrants | India | 100.0 /100 | #16 | Exceptional 94.5% |
| Luxembourgers | 100.0 /100 | #17 | Exceptional 94.5% |
| Maltese | 100.0 /100 | #18 | Exceptional 94.5% |
| Scandinavians | 100.0 /100 | #19 | Exceptional 94.5% |
| Italians | 100.0 /100 | #20 | Exceptional 94.5% |
| Tlingit-Haida | 100.0 /100 | #21 | Exceptional 94.4% |
| Tsimshian | 100.0 /100 | #22 | Exceptional 94.4% |
| Czechs | 100.0 /100 | #23 | Exceptional 94.4% |
| English | 100.0 /100 | #24 | Exceptional 94.4% |
| Irish | 100.0 /100 | #25 | Exceptional 94.4% |
| Scottish | 100.0 /100 | #26 | Exceptional 94.4% |
| Europeans | 100.0 /100 | #27 | Exceptional 94.4% |
| Estonians | 100.0 /100 | #28 | Exceptional 94.4% |
| Dutch | 100.0 /100 | #29 | Exceptional 94.3% |